

Trading indicators are an unavoidable part of the financial market. So no wonder that expert crypto traders rely on many trading indicators to determine more accurate trading positions and reduce risks. Heiken Ashi is one of the effective technical indicators to crypto investors for its functionalities.
Technical indicators enable crypto traders to obtain market data through various calculations through several significant factors. However, it requires a certain level of understanding when any crypto trader expects to execute constantly successful trades. This article will introduce you to Heiken Ashi alongside describing sustainable short-term and long-term trading strategies applicable to the cryptocurrency market.
What is Heiken Ashi indicator?
It is a technical indicator that crypto traders use to determine different phases of price movements. In Japenese, Heiken Ashi means “average bar” and Munehisa Homma is the developer of Heiken Ashi chart. It usually uses an average period-based modified formula rather than traditional candle calculations to show a more smooth appearance. It becomes easier to spot crypto assets’ current trends and reversal points. The developing period of this indicator formula was in the 1700s.
How to trade using the Heiken Ashi indicator?
Crypto investors use Heiken Ashi to determine the current trend. A green candle with no lower shadow declares the buying pressure on the asset price and an uptrend. On the other hand, when a long red candle appears that has no shadow on the upside declares declining pressure on the asset price.
Crypto market participants often combine this indicator info with other technical indicators and tools while making trade decisions. This indicator enables reading charts more effectively and easier to determine trendy price movements.
Short-term trading strategy
We use another popular technical indicator, the MACD, alongside Heiken Ashi in our short-term trading method. MACD shows readings on an independent window. Crypto investors typically identify any upward or downward momentum initiation through this indicator, and Heiken Ashi confirms the trend. In this way, traders can easily determine the most potent short-term trading positions. We recommend using an hourly or 15-min chart when seeking entry/exit trading points through this trading method.
Bullish trade scenario
Set both the MACD and Heiken Ashi on any preferable time frame chart and observe when:
- The dynamic blue line crosses the dynamic red line on the upside at the MACD window.
- Both dynamic lines of the MACD window are near the central line and heading toward the upside.
- MACD green histogram bar takes place above the central line.
- Heiken Ashi shows a large buy candle with no lower wick.
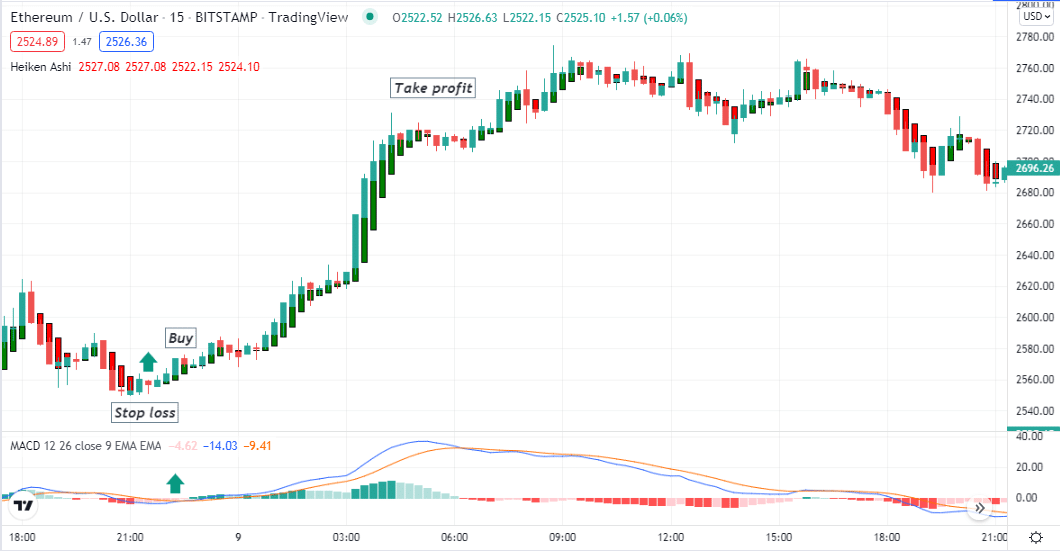
Entry
Match these conditions above your target asset chart; it declares buyers’ domination on the asset price. Enter a buy order.
Stop loss
The initial stop loss level will be below the current bullish momentum with a buffer of 5-10pips.
Take profit
Close the buy order when:
- The dynamic blue line drops below the dynamic red line at the MACD window.
- MACD red histogram bars take place below the central line.
- Heiken Ashi shows a sell candle with no wick on the upside.
Bearish trade scenario
Set both the MACD and Heiken Ashi on any preferable time frame chart and observe when:
- The dynamic blue line crosses the dynamic red line on the downside at the MACD window.
- Both dynamic lines of the MACD window are near the central line and heading toward the downside.
- MACD red histogram bar takes place below the central line.
- Heiken Ashi shows a large sell candle with no upper wick.
Entry
Match these conditions above your target asset chart; it declares sellers’ domination on the asset price. Enter a sell order.
Stop loss
The initial stop loss level will be above the current bearish momentum with a buffer of 5-10pips.
Take profit
Close the sell order when:
- The dynamic blue line surge above the dynamic red line at the MACD window.
- MACD green histogram bars take place above the central line.
- Heiken Ashi shows a buy candle with no wick on the downside.
Long-term trading strategy
We use the two most popular technical indicators, the RSI and an HMA (20) line alongside Heiken Ashi, to generate long-term trading ideas. When making trade decisions by combining these three indicators readings, it delivers more accurate trading positions. We recommend using a daily or H4 chart to determine trading positions.
Bullish trade scenario
Implement all these indicators and observe when:
- The RSI dynamic line is near the central (50) line and heading on the upside.
- Price candles start closing above the HMA line.
- The HMA line slops on the upside.
- Heiken Ashi shows a green candle with no shadow on the lower side.
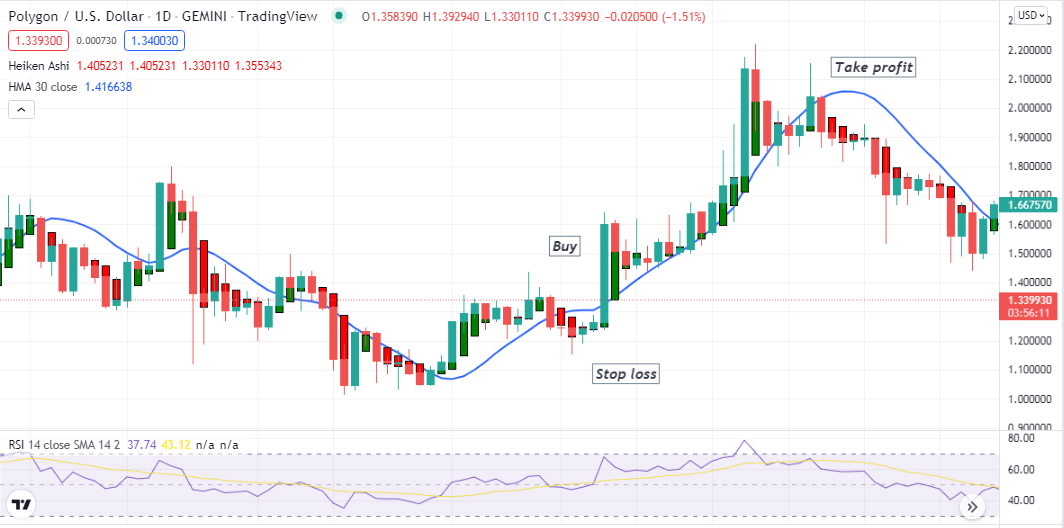
Entry
When these conditions above match your target asset chart, it declares a bullish momentum initiates. Open a buy position.
Stop loss
Place an initial stop loss below the current bullish momentum.
Take profit
Close the buy position when:
- The RSI dynamic line reaches the upper (70) level or declines after getting that level.
- Price candles start closing below the HMA line.
- Heiken Ashi shows a sell candle with no wicks on the upper side.
Bearish trade scenario
Implement all these indicators and observe when:
- The RSI dynamic line is near the central (50) line and heading on the downside.
- Price candles start closing below the HMA line.
- The HMA line slops on the downside.
- Heiken Ashi shows a red candle with no shadow on the upper side.
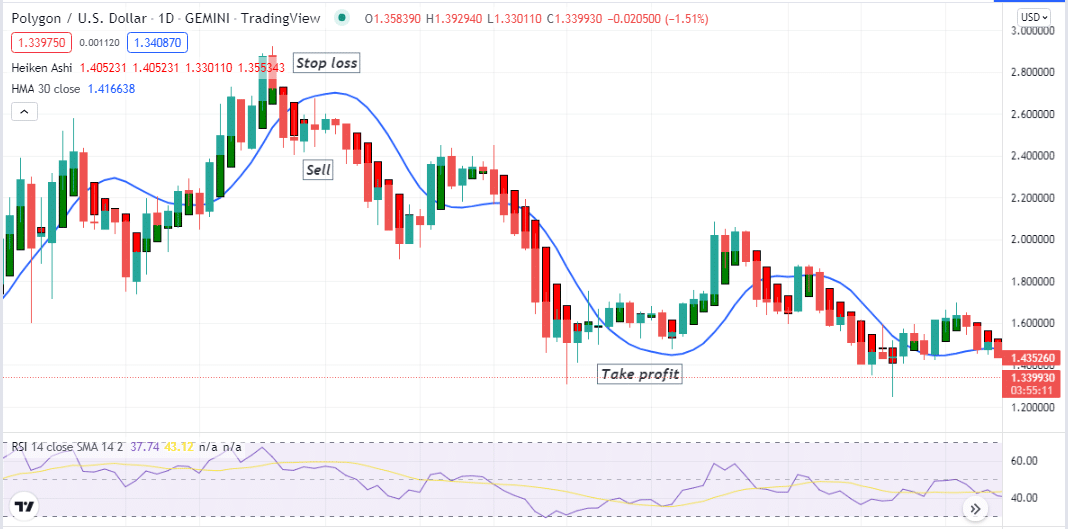
Entry
When these conditions above match your target asset chart, it declares a bearish momentum initiates. Open a sell position.
Stop loss
Place an initial stop loss above the current bearish momentum.
Take profit
Close the sell position when:
- The RSI dynamic line reaches the lower (30) level or increases after getting that level.
- Price candles start closing above the HMA line.
- Heiken Ashi shows a buy candle with no wicks on the lower side.
Pros and cons
| Pros | Cons |
| Heiken Ashi is a handy technical indicator for crypto traders that suits many crypto assets. | Any Heiken Ashi crypto trading strategy can fail due to fundamental reasons. |
| This indicator generates both long-term and short-term trading positions. | This indicator does not fit in scalping. |
| It is a straightforward indicator for any crypto trader from newbie to expert. | Often generates false signals in consolidating phases or short-term trades. |
Final thought
Heiken Ashi is a unique trading indicator for use in many financial assets. The lagging part suggests closing any live trade after a significant opposite force on the asset price. So it is better to close any positions by following other indicators reading to maximize profits.


