
Horn and tops is a good trading pattern that frequently appears in the trading chart and indicates a potential price reversal. If you are intended to find a reliable trend continuation and reversal pattern, the Horn tops and bottom would be a good option for you.
Once the price action matches the broader market direction, you can take trades. However, taking trades using candlestick patterns needs close attention to the broader market context and fundamental releases. If you are interested in bringing your trading career one step further, the following section is for you.
Here you will see the nuts and bolts of Horn tops and bottoms pattern. Investors include the exact way to buy and sell with a proper trade management system to build a trading strategy.
What is the Horn top & bottoms pattern?
This combination of candlesticks can show a reliable price trend by forming at the bottom or top of the current trend. It is a combination of three candles where the first and last candle is comparatively higher in size than the second candle. The reason to include the word “Horn” is that the visual pattern looks like the English letter “H.”
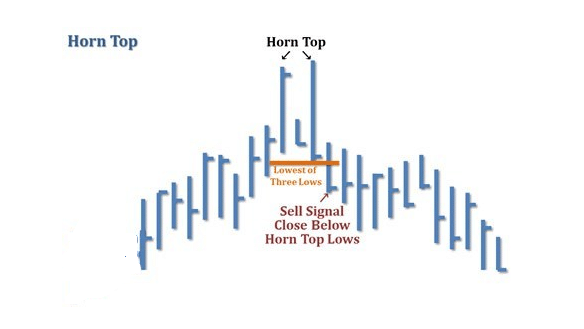
The above image visually shows how the Horn tops pattern looks like. It usually appears at the top of a bullish trend and indicates that bulls have lost momentum and bears have become active.
On the contrary, the Horn bottom pattern is the opposite version of the bullish pattern, indicating that the existing bearish trend is ending and bulls are interested in taking the price up. This pattern looks like the upside-down cow Horn, where the validity depends on several factors like the trend, economic releases, and broader market context.
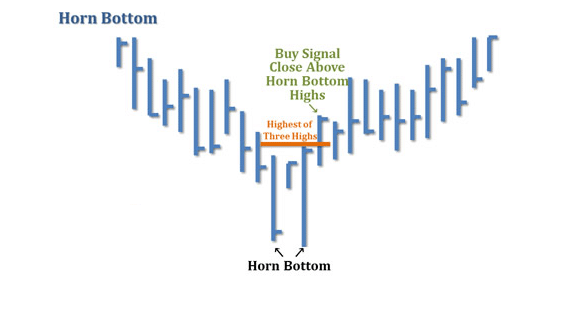
The above image shows what the Horn bottom pattern looks like. As per the image, it becomes valid once the pattern completes by closing the third candle above the recent swing high.
How to identify the trend using the Horn top and bottom pattern?
The primary aim of traders is to spot these patterns in the perfect location. You cannot open a buy or sell trade just by looking at these patterns. The pattern should be logical by representing what investors are doing in the chart. We all know that the basic support level encourages bulls to join the market, and the price is likely to fall from the resistance level. Therefore, any Horn bottom pattern from a reliable support level signifies that bears have already lost their momentum and bulls have joined the market.
Overall, the Horn top and bottom pattern work as a trading tool. To build a trading strategy, investors should use other indicators like volume, oscillator, price action, candlestick, or pivot points.
A short-term strategy
This method includes finding the intraday market trend using the Horn tops and bottom patterns. In that case, investors should have a clear idea about where the broader market is heading. If the short-term price direction and long-term price direction are not the same, you will likely make losses.
Besides using this trading indicator, investors should use other tools to increase the trades probability. For this strategy, we will use Parabolic SAR and ADX. Therefore, we will open buy or sell orders in 15 minutes to catch the price trend from the London session.
Bullish trade setup
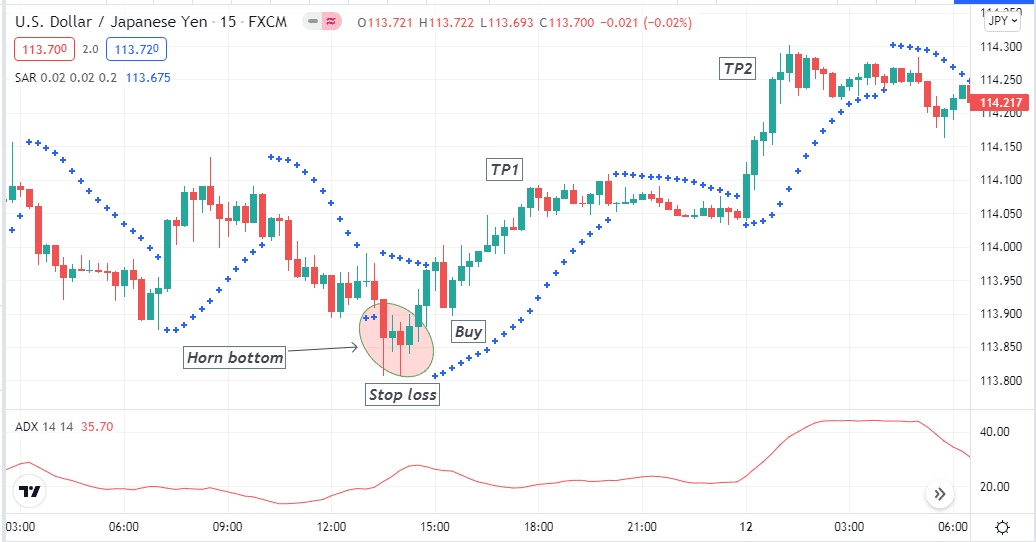
Before opening a buy trade setup all indicators in the price chart and follow trading conditions from the below section:
- Parabolic dots are below the price, indicating that the price is above the dynamic support level.
- The ADX is above 20, which is a sign of active traders presence in the current trend.
- When all these indicators show, a buy signal finds the Horn bottom pattern and opens the buy trade after the pattern completes.
- The ideal stop loss is below the swing low with some buffer.
- The take profit level depends on the strength of the market trend. In that case, close 50% of the trade from 1:2 risk vs reward ratio and hold it for further gains.
Bearish trade setup
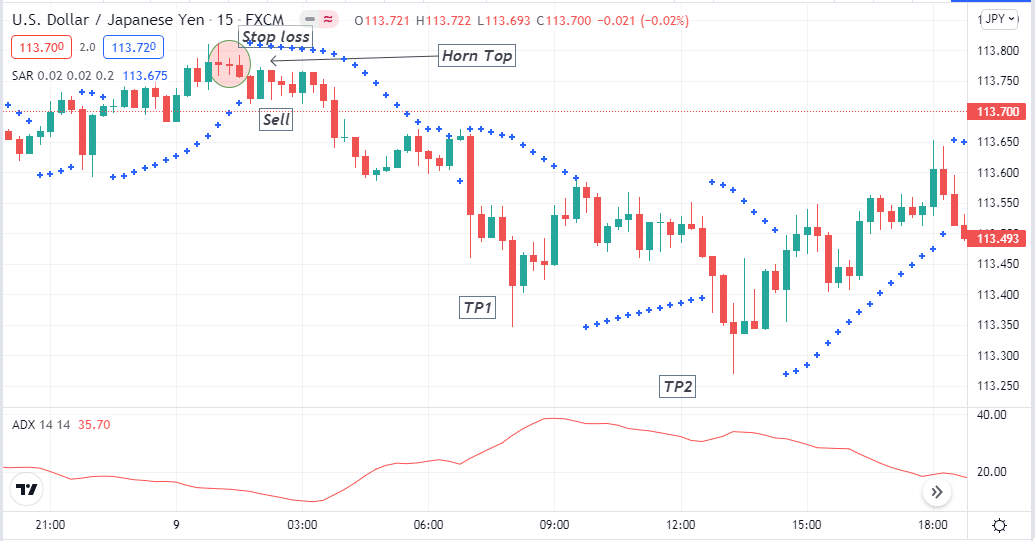
Before opening a sell trade setup all indicators in the price chart and follow trading conditions from the below section:
- Parabolic dots are above the price, indicating that the price is below the dynamic resistance level.
- The ADX is above 20, which signifies active traders’ presence in the current trend.
- When all these indicators show a sell signal, find the Horn top pattern and open a sell trade after the pattern completes.
- The ideal stop loss is above the swing high with some buffer.
- Close 50% of the trade from 1:2 risk vs. reward ratio and hold it for further gains.
A long-term trading strategy
The long-term method is to identify the price direction using the swing or position trading strategy. Besides this indicator, you can use other tools like MACD and HIMA. Once all indicators show the trading signal, you can open the buy/sell position.
Bullish trade setup
Implement those indicators in the chart and take trades based on the following conditions:
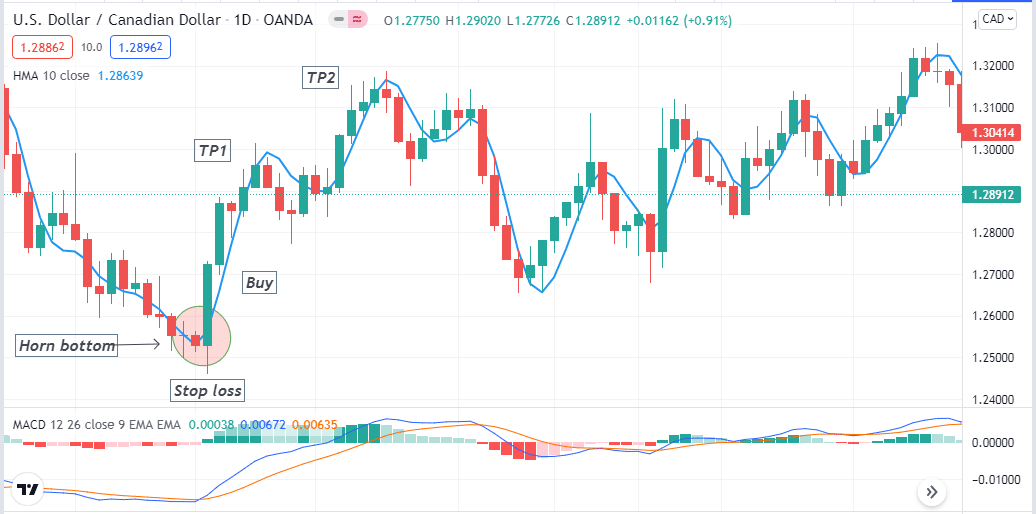
- The HMA is moving up, indicating buyers’ presence in the price.
- The MACD histogram is bullish and aiming higher.
- A Horn bottom pattern appears and closes its third candle above the HMA.
- Open the buy trade after the Horn bottom pattern completes.
- The stop loss is below the market swing with some buffer.
- The take profit level is based on market context and near-term resistance levels.
Bearish trade setup
Implement those indicators in the chart and take trades based on the following conditions:
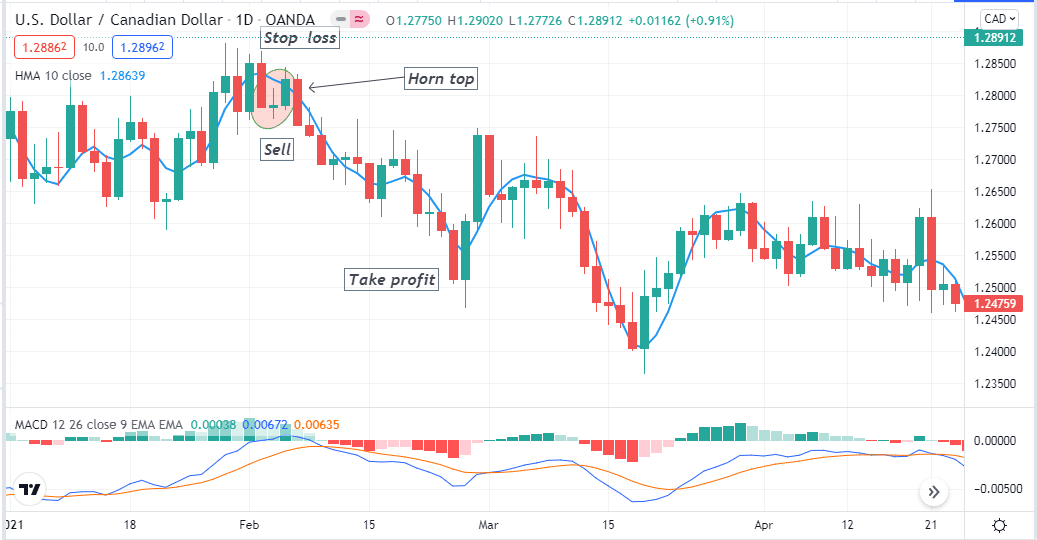
- The HMA is moving down, indicating sellers’ presence in the price.
- The MACD histogram is bearish and aiming lower.
- A Horn top pattern appears and closes its third candle below the HMA.
- Open the sell trade after the Horn bottom pattern completes with the SL above the near-term swing high.
- The take profit level is based on market context and near-term support levels.
Pros and cons
Let’s see the pros and cons of the Horn tops and bottom trading method.
| Pros | Cons |
| This pattern is very profitable and can generate trades by matching with other indicators directions. | This pattern alone cannot generate a profitable trading signal. It needs help from other trading tools. |
| It is applicable in any trading instrument from majors, minors, and exotics. | It is hard to find this pattern with other charts’ conditions frequently. |
| It is a combination of three candlesticks; it is easy to spot in the chart. | It often provides false signals, so a good trade management system is essential. |
Final thought
The Horn tops and bottoms pattern is profitable once traders understand the core concept with a sound trade management system. It is not wise to implement this method in an uncertain situation like essential financial releases.