
Order flow shows a reliable price movement from any supply or demand zone that may retrace and show a profitable trading opportunity.
If the price reaches any critical S/R level, it might show a reverse or breakout. But traders don’t know from which level they should take reversal trades. Understanding the order flow opens room to find the price direction, and if the trading setup comes to that direction, it has a higher possibility of reversal than a breakout.
Before going further about the order flow trading technique, we should understand when and how the imbalance forms. After completing the whole section, you will realize two ways to find order flow with different trading approaches.
What is order flow
It is the number of buys and sells orders at a specific price level. We can define these orders by looking at the naked chart.
Looking at the forex chart, you probably noticed some strong rally, either upside or downside. The rally on the buy-side comes when buyers are stronger than sellers. As a result, the excessive buying position starts making the price higher. The same concept is applicable in the bearish market where selling pressure exceeds buying pressure.
Let’s see an example of these movements from a price chart.
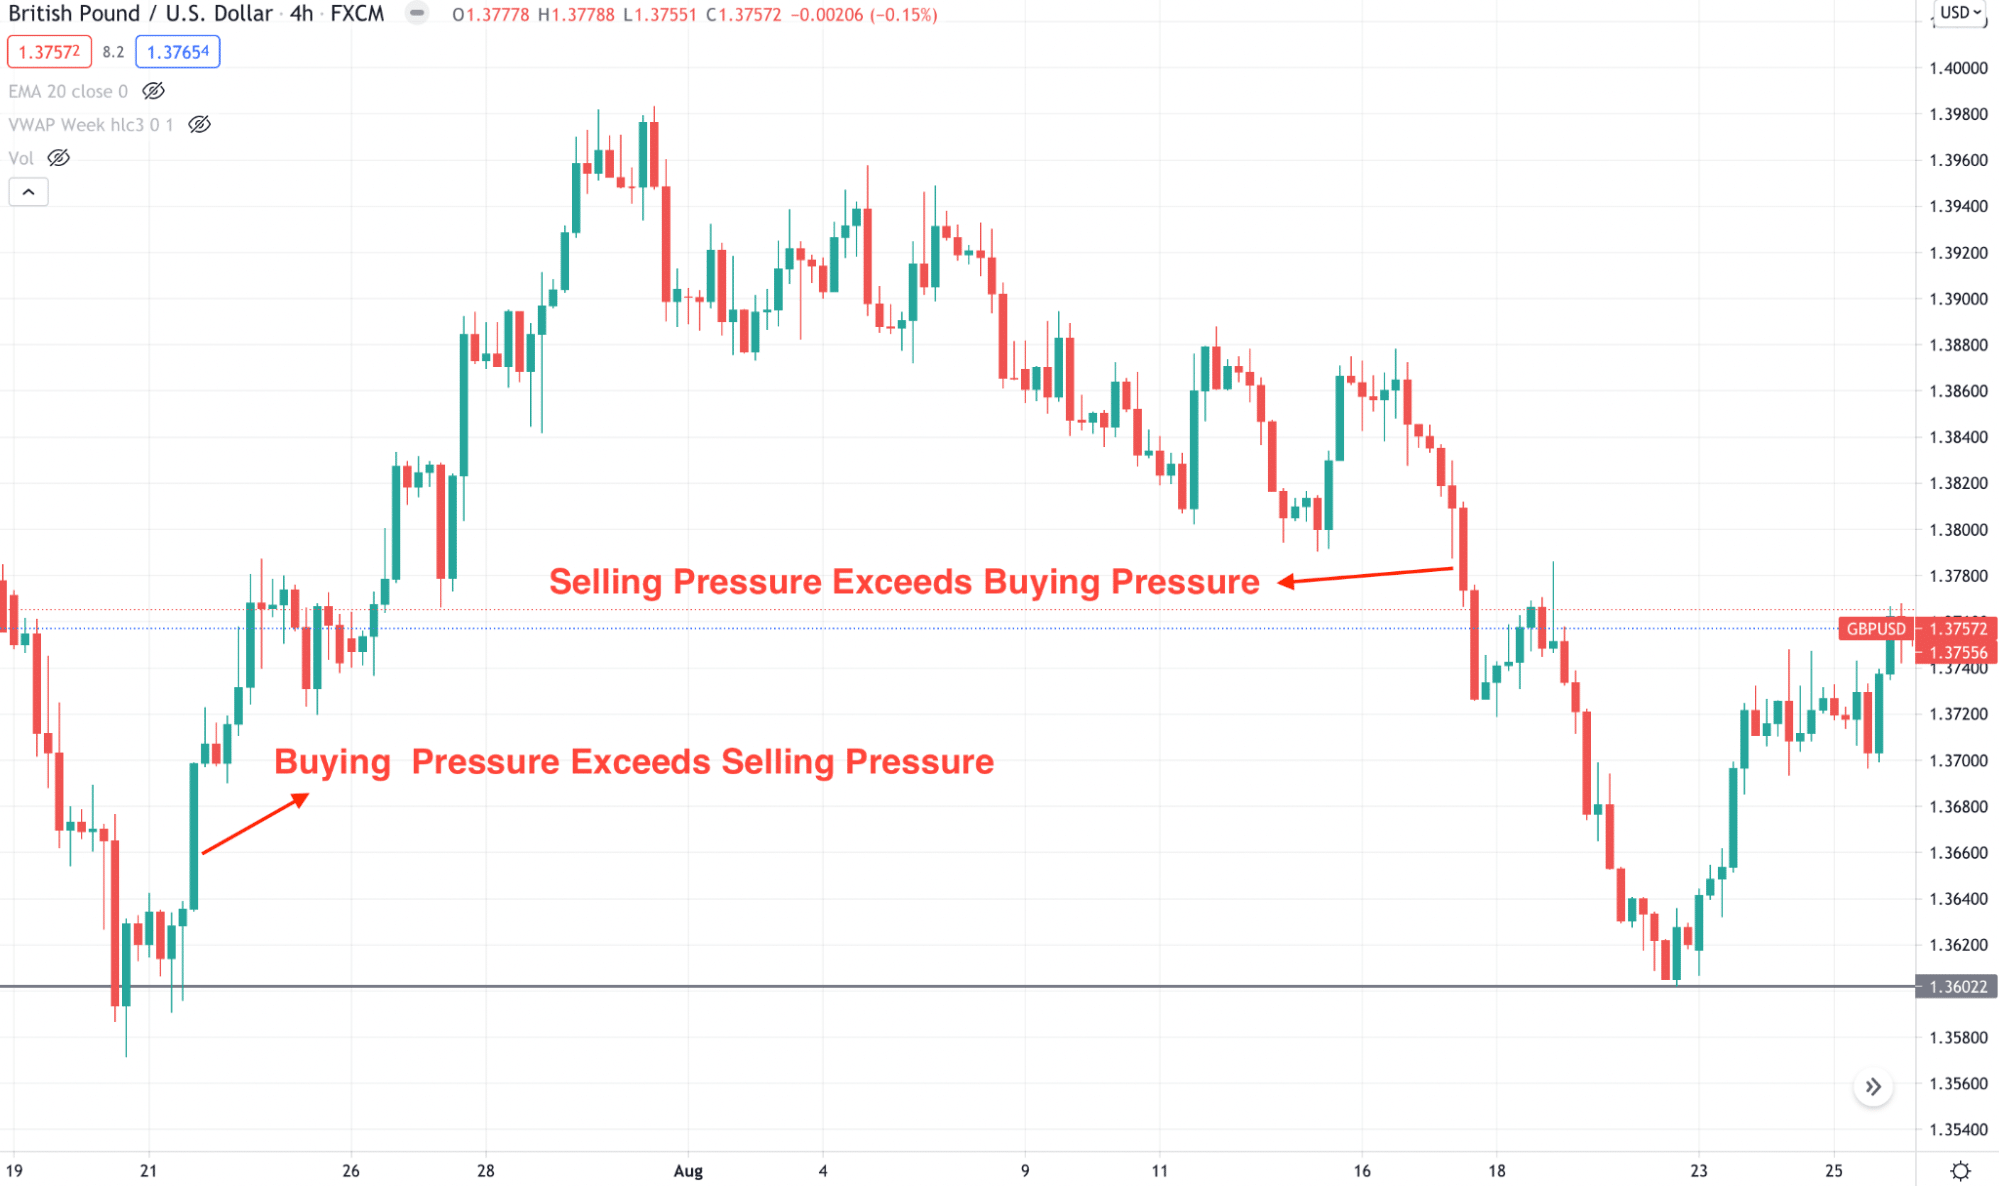
In other words, when demand exceeds supply, the price will move up, and when supply exceeds demand, the price will show a downward movement. We can also call this movement an imbalance. In the above image, the buying imbalance came with excessive buying pressure, and the selling imbalance came from excessive selling pressure.
This simple scenario happens in micro and macro price levels that cause the price to move and reverse. By understanding the imbalance, you can anticipate the exact exit point of your trade.
Order flow is a unique technique of predicting the price movement where the primary aim is to find the place where imbalance happened. Therefore, you can enter the market with more confidence.
How the find the order flow
In the above section, we have seen the theoretical part of order flow and imbalance, but in trading, you are dealing with the real money in your chart that requires a strong knowledge of the market and price action.
Naked chart analysis
The best way to anticipate the order flow is by finding a naked chart. You don’t have to integrate any indicator or drawing levels, trendlines, or Fibonacci’s to the chart. All you need to see is the location where the imbalance happened. More particularly, find the market swing levels and imbalance near it.
Let’s have a look at an example.
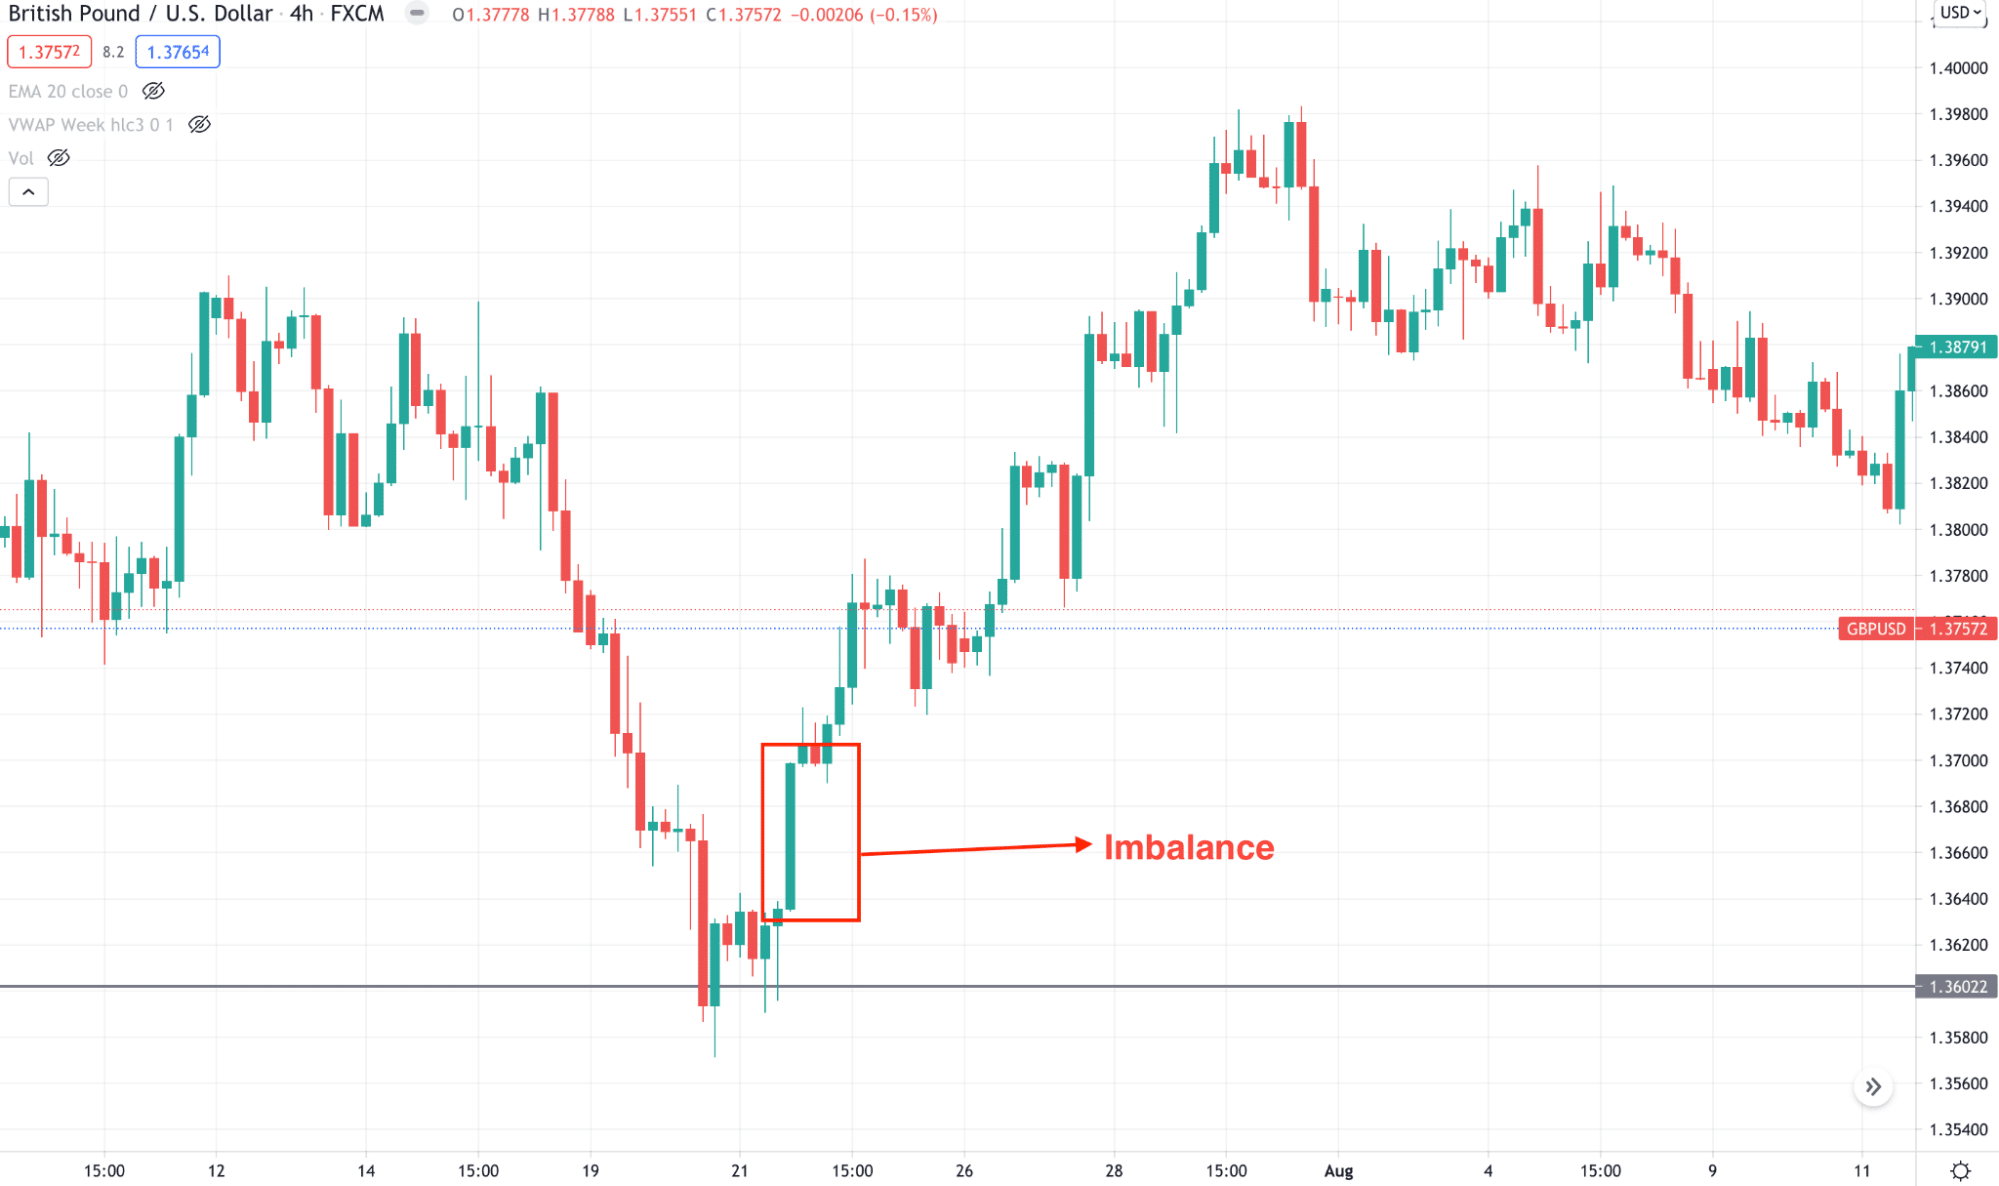
In the above image, we can see the H4 chart of GBP/USD, where the price came down to 1.3600 psychological support and started a correction. Later on, the price moved higher by breaking with a candle that had never been visited before reaching the near-term high. Therefore, the candle that did not visit is an imbalance.
The core idea of trading imbalance is to wait for the price to break the near-term high and reverse the imbalance level. Breaking the near-term high will indicate that buying pressure at the imbalance is strong, and the corrective rebound signifies that buyers did not complete their order and they would fill order once the price comes to the imbalance level.
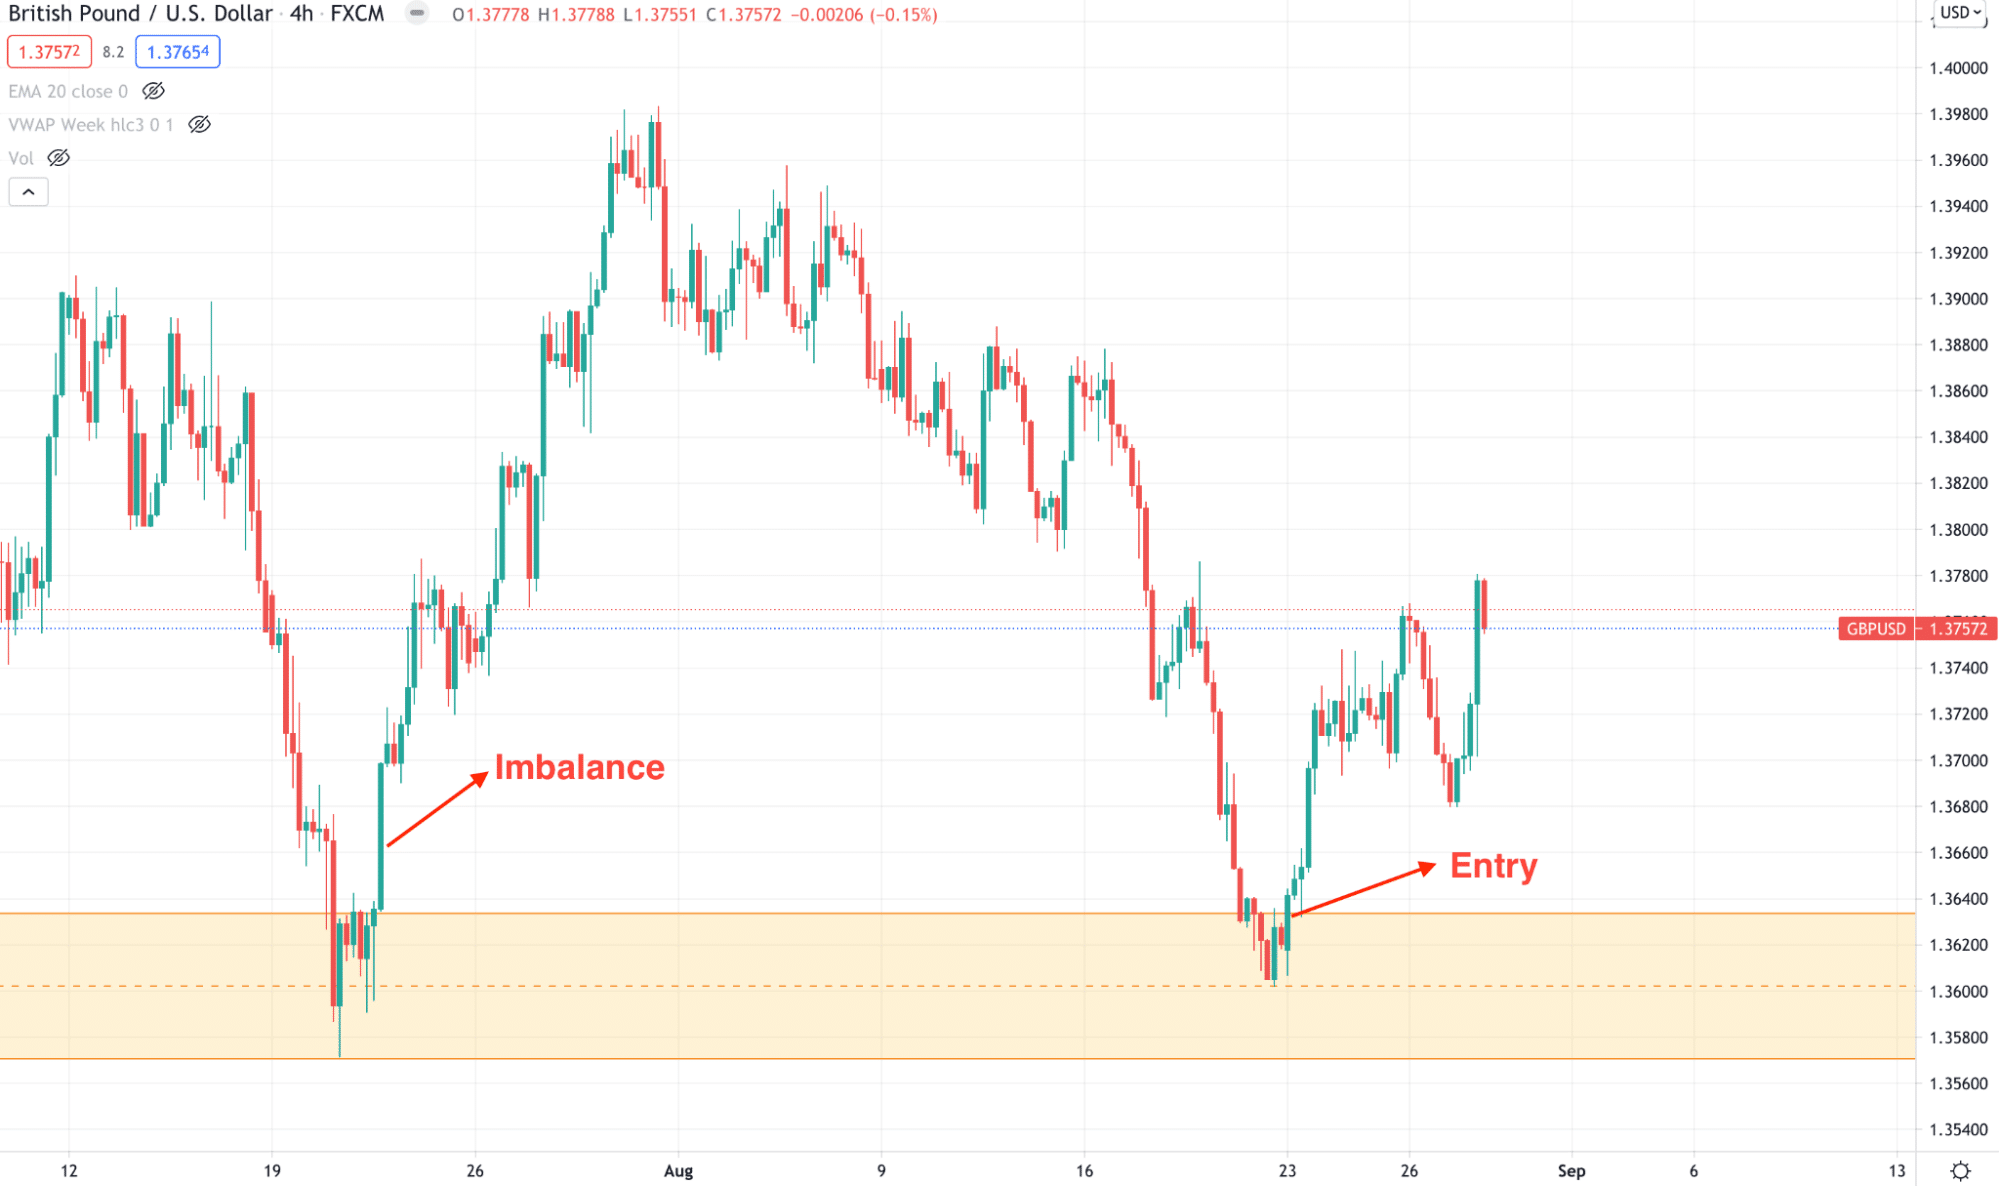
The above image shows how the price moved higher from the imbalance and revisited the level by potential buying entry.
Besides using the imbalance, you can add other trading tools like volume to increase the probability. When the price revisits the zone with a higher volume, you can consider the buying position as pore potential.
Use of ATR
ATR or Average True Range shows the average price movement in a specific time frame. It will help traders to get the market direction. For example, if the price of a trading asset changes around 2% in a week, we can consider this percentage as a standard. If the percentage jumps to 2.5% at any week, we can consider the buying pressure more potent than the average.
Therefore, any new high in ATR shows that the order flow has increased in a particular time frame. Therefore, if your trading strategy finds a buy setup from that price point, you can rely on it.
Let’s see an example of ATR in the EUR/USD chart.
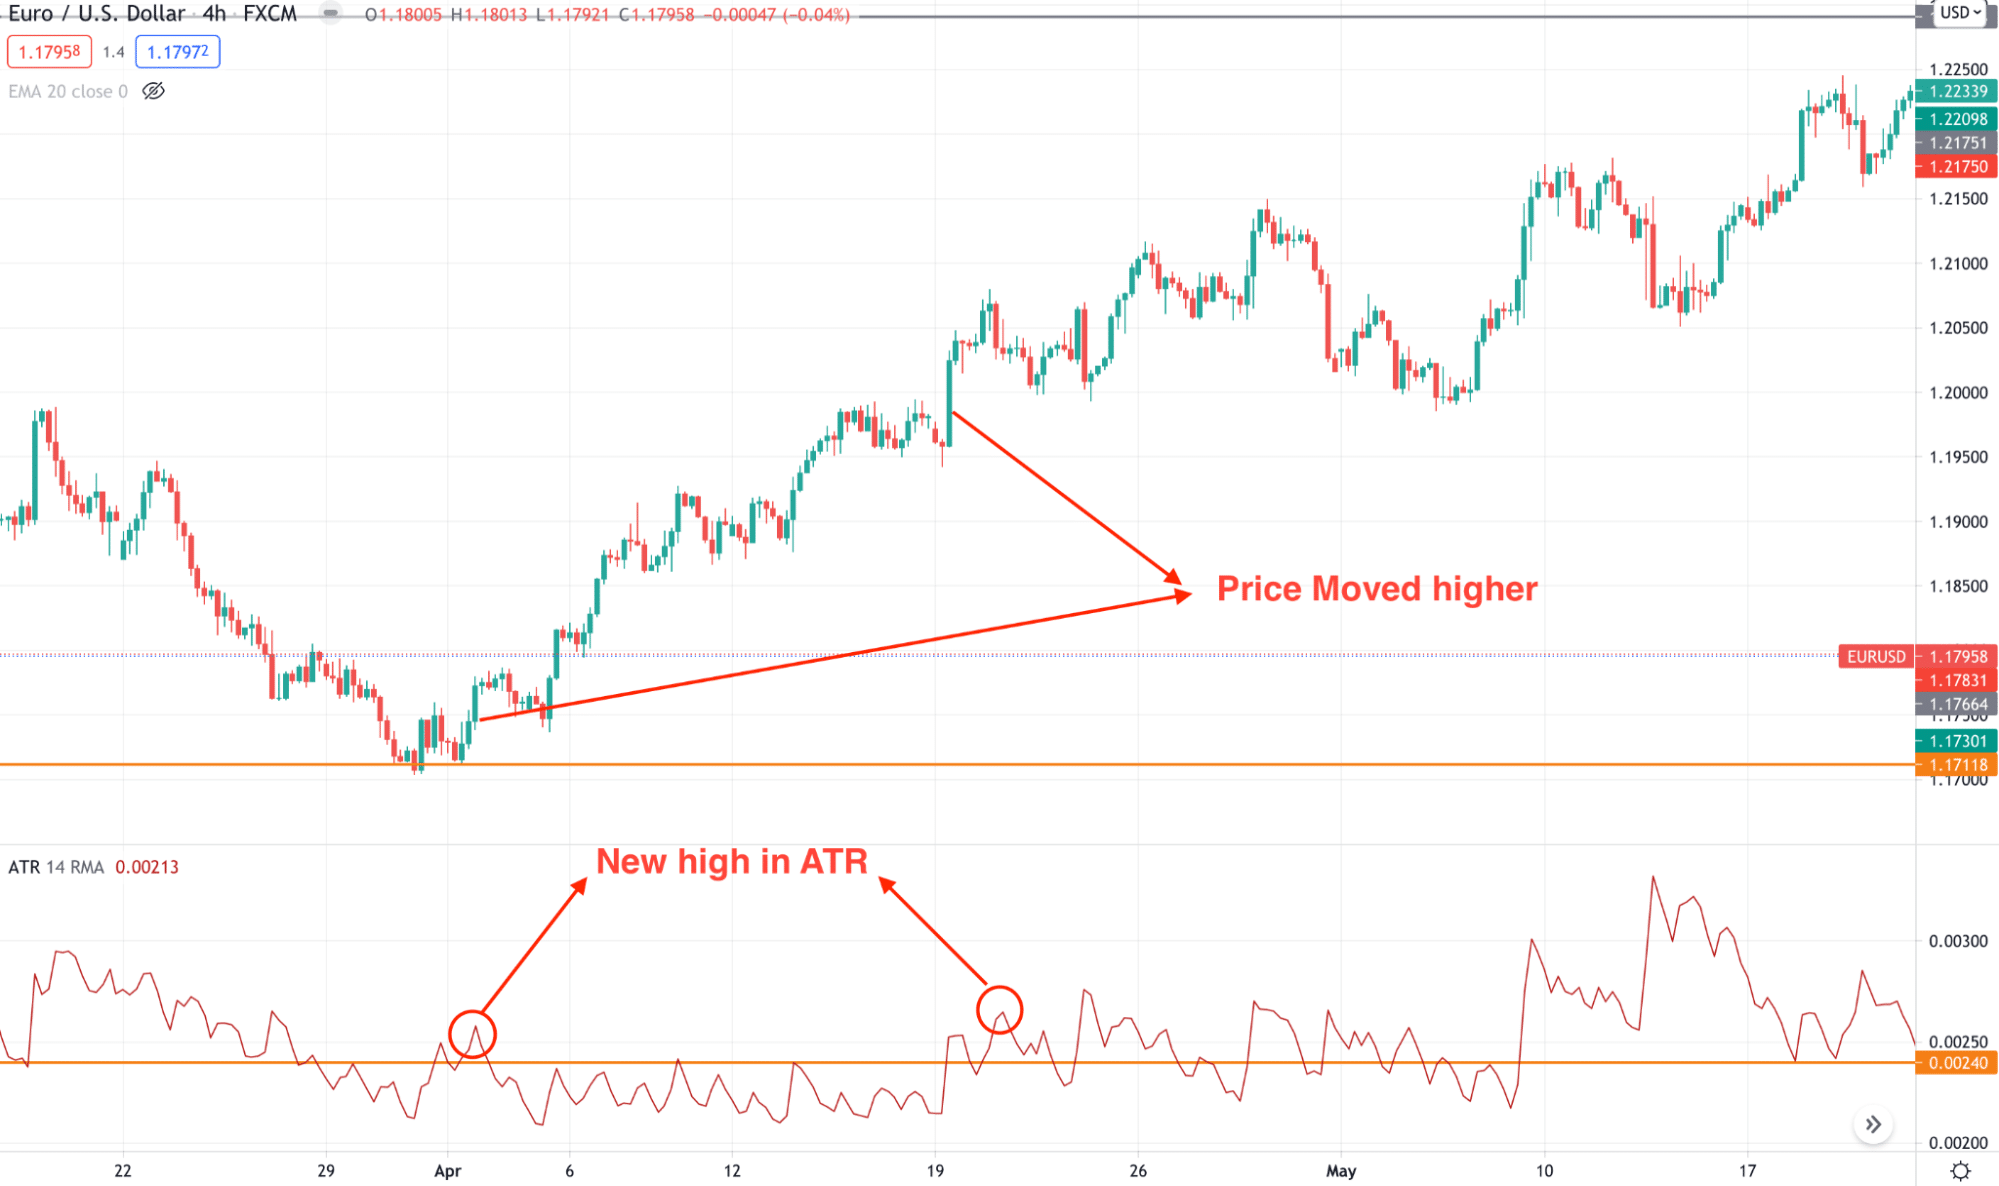
ATR is a good trading indicator to find the market pressure or imbalance, and it works well in bullish and bearish markets. However, it has some drawbacks, like it may provide false signals, or your direction might be wrong if it did not match the higher time frame’s direction. In that case, traders should use other trading tools or indicators besides the ATR.
How to open a trade?
There are two approaches in order flow trading:
- You can sit in front of the market and open a position when the setup comes.
- Otherwise, you can open a pending order so that the price can hit and move towards the direction.
In intraday trading, finding an active session is the first requirement. Any good trade setup in London or New York session has a higher probability of working out as big investors remain active at that time. In manual trading, wait for an appropriate candlestick to form before hitting the buy or sell order.
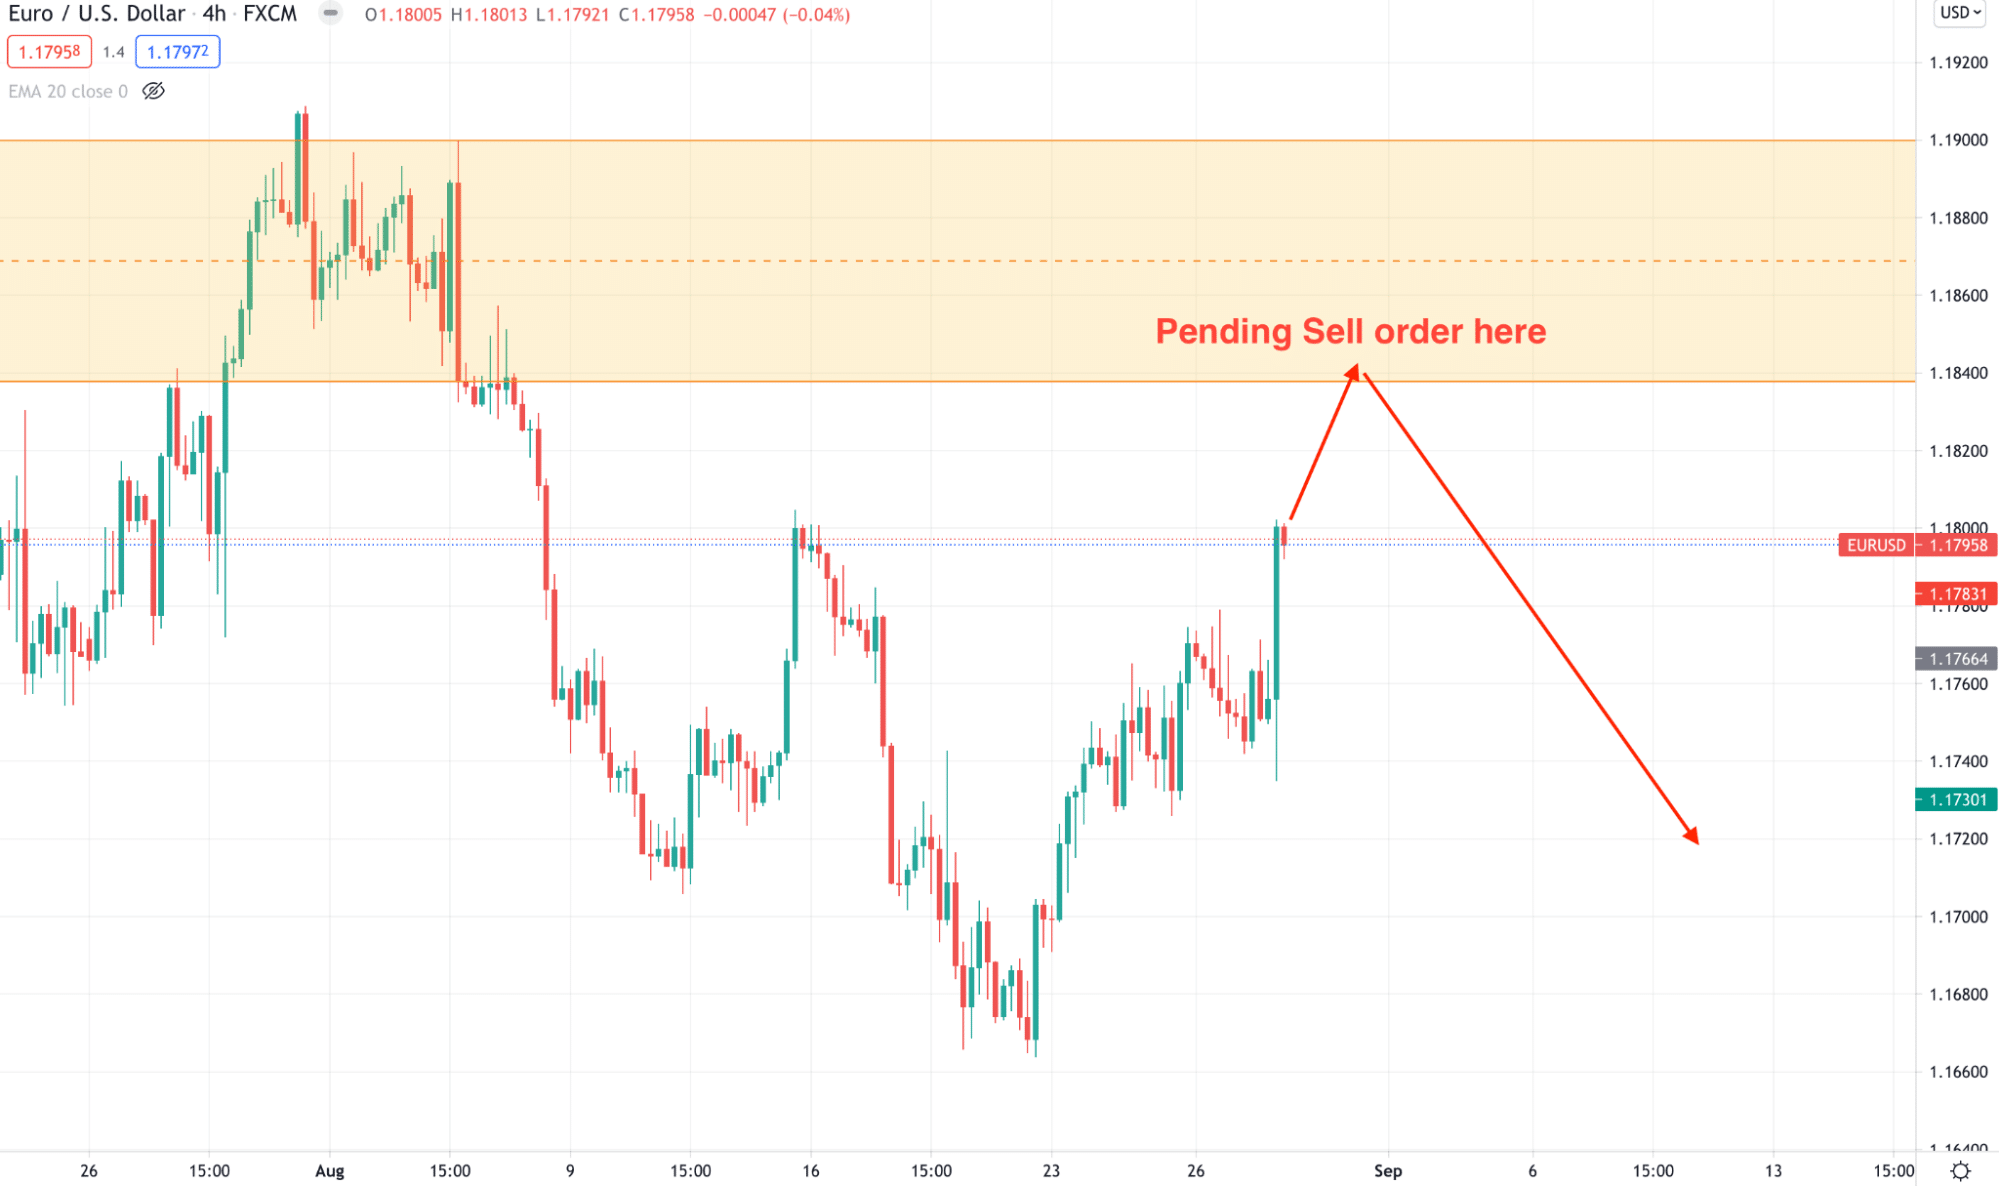
The above image shows how to set a pending order from a supply area. Once the price reaches the low of the last bullish candle, the trade will open automatically.
Final thoughts
All trading strategies require following some steps from market analysis to trade management. Otherwise, you will fail to earn money even if the trading strategy is good. The order flow shows an aspect of the market that will help to execute the trade effectively.
If you use this technique, you can have the following benefits from the market:
- A better understanding of the market context
- Better risk and ratio
- Finding the way to define the exact point of buying and selling a trading instrument
- This method works well in any time frame
- It is easily adjustable with other methods