
Marubozu candlestick is a standard pattern for trades to obtain the market context for any financial asset chart. Every candle reflects participants’ actions during that specific period. Learning the candles enables traders and investors to read the footprint of the market context besides predicting the future movement of the asset prices.
However, several types of Marubozu patterns are available that have different signal directions in the price movement. In this article, we will introduce you to all kinds of Marubozu candlestick patterns besides functionalities and trading strategies using those patterns.
What is a Marubozu candle?
It is a single candle formation that contains a large body. The body of the Marubozu candles can be red or green. Different bodies signal different price directions. It is hard to miss this pattern as the formation is unique.
Three different types of Marubozu patterns are available on the financial market.
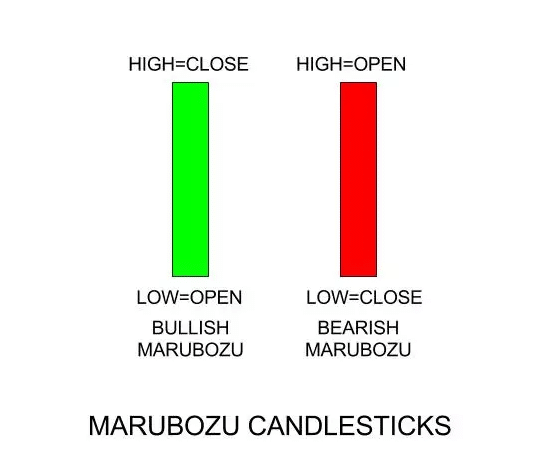
Marubozu full
This type of candle contains no wicks on any side of the candle, only has a long body. Bullish Marubozu’s entire candle has a green body, and the bearish Maribozu candle has a red body.
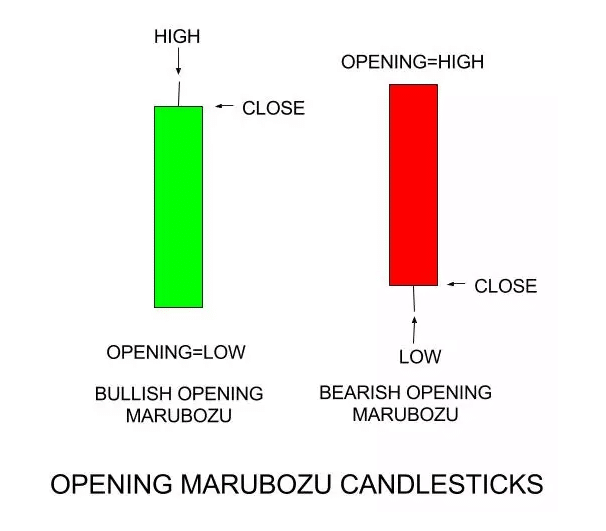
Marubozu open
Marubozu candles have wicks on only one side. Bullish Marubozu open candles have an upper wick; meanwhile, bearish Marubozu open contains a lower wick.
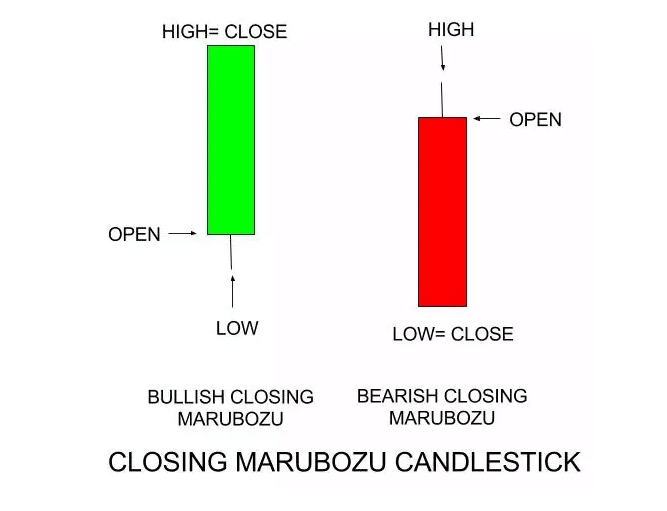
Marubozu close
Marubozu close candles are just the opposite version of Marubozu open candles. Whereas bullish Marubozu close candle has a lower wick and bearish Marubozu candle has upper wicks.
How to trade using Marubozu candles?
You already know that the candle formation contains a large body with small wicks on any one side or not. Ideal Marubozu candles have no wicks. That declares the market context very well that the current trend may remain intact as the Marubozu style (bullish or bearish).
You can group this pattern into a continuation pattern, although sometimes it signals reversal also. This pattern is straightforward to identify for its formation. Trading using this pattern is easy; identify the pattern on your target asset chart.
For more confirmation, combine other technical market contexts with various available technical tools and indicators to determine your entry/exit points. Execute your trade according to your trading strategy.
Now, look at our trading strategies below for a better understanding.
A short-term trading strategy
In our short-term trading technique, we use three technical indicators besides the Marubozu pattern. We use the stochastic oscillator, hull moving average value of 20 periods, and the volume indicator. This trading strategy suits any trading asset; we recommend using a 15-min chart to chart the most potential short-term trading positions.
Bullish trade scenario
Mark any bullish Marubozu candle on your target asset chart and observe indicator readings when:
- The dynamic blue line crosses above the dynamic red line on the stochastic window.
- Both dynamic lines are heading toward the upper (80) line on the stochastic window.
- Volume indicator declares increasing buy volume.
- The bullish Marubozu candle closes above the HMA line, and the HMA line is sloping on the upside.
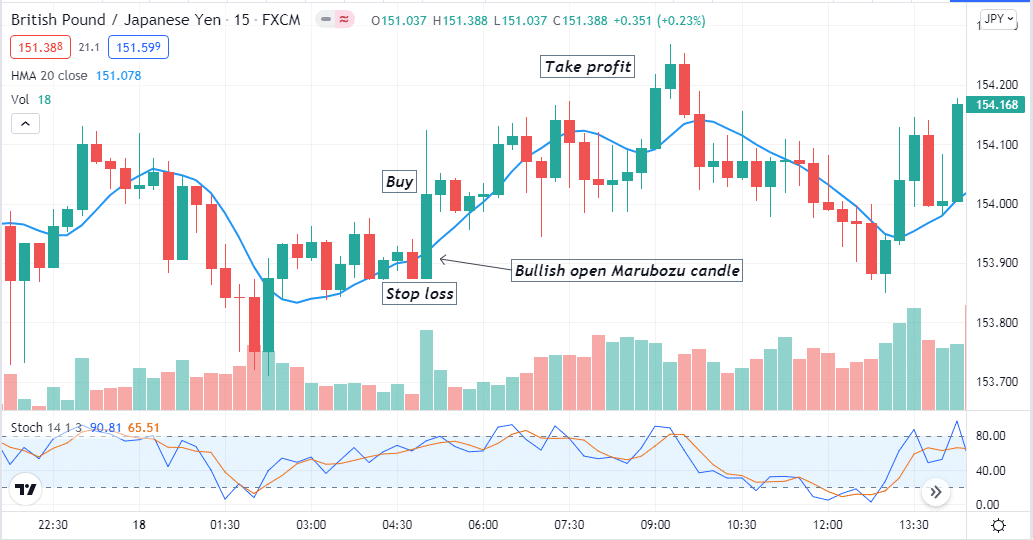
Entry
When these conditions above match your target asset chart, place a buy order after closing the bullish Marubozu candle.
Stop loss
Place an initial stop loss below the bullish Marubozu candle.
Take profit
Close your buy position when:
- The volume indicator declares increasing sell volume.
- Price candles close below the HMA line.
- Both dynamic stochastic lines are heading on the downside after reaching the upper (80) level.
Bearish trade scenario
Mark any bearish Marubozu candle on your target asset chart and observe indicator readings when:
- The dynamic blue line crosses below the dynamic red line on the stochastic window.
- Both dynamic lines are heading toward the lower (20) line on the stochastic window.
- Volume indicator declares increasing sell volume.
- The bullish Marubozu candle closes below the HMA line, and the HMA line is sloping on the downside.
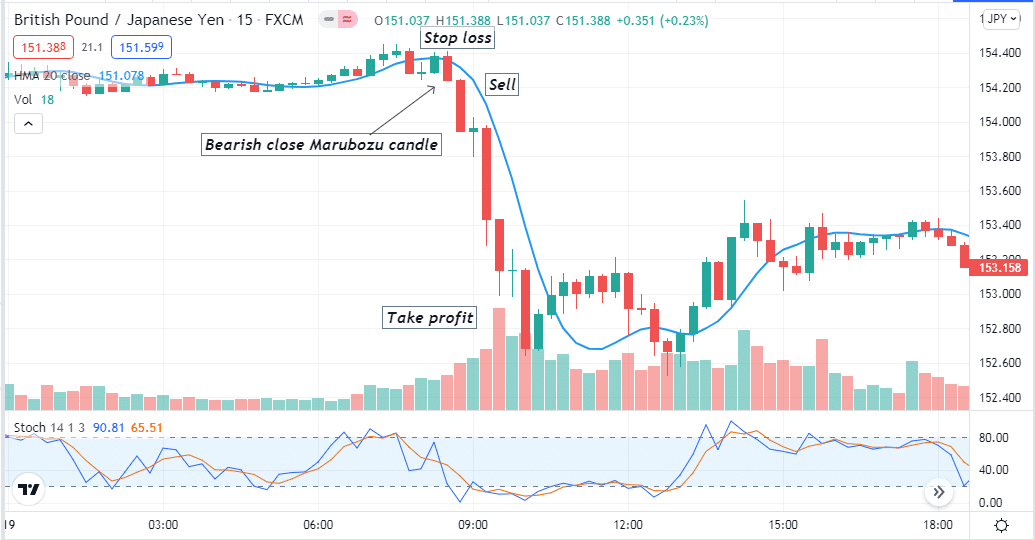
Entry
When these conditions above match your target asset chart, place a sell order after closing the bearish Marubozu candle.
Stop loss
Place an initial stop loss above the bearish Marubozu candle.
Take profit
Close your sell position when:
- The volume indicator declares increasing buy volume.
- Price candles close above the HMA line.
- Both dynamic stochastic lines are heading on the upside after reaching the lower (20) level.
A long-term trading strategy
Our long-term triaging strategy using the Marubozu pattern involves using the MACD and the volume, two popular technical indicators. This strategy suits any trading asset. Meanwhile, the time frame that is ideal for this trading method is D1.
Bullish trade scenario
Mark a bullish Marubozu candle and observe the readings of the indicators, when:
- The dynamic blue line crosses above the dynamic red line on the MACD window.
- MACD green histogram bars appear above the central line.
- The volume indicator declares increasing buying pressure.
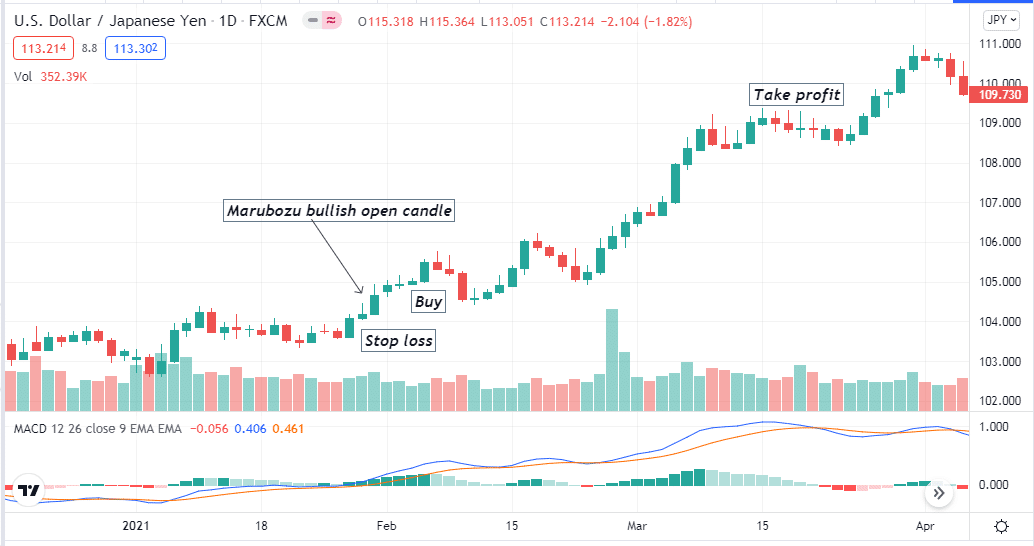
Entry
When these conditions above match with your target asset chart, place a buy order.
Stop loss
Place an initial stop loss below the bullish Marubozu candle.
Take profit
Close the buy order when:
- The volume indicator declares increasing sell volume.
- The dynamic blue line crosses below the dynamic red line.
- MACD red histogram bars take place below the central line.
Bearish trade scenario
Mark a bearish Marubozu candle and observe the readings of the indicators, when:
- The dynamic blue line crosses below the dynamic red line on the MACD window.
- MACD red histogram bars appear below the central line.
- The volume indicator declares increasing selling pressure.
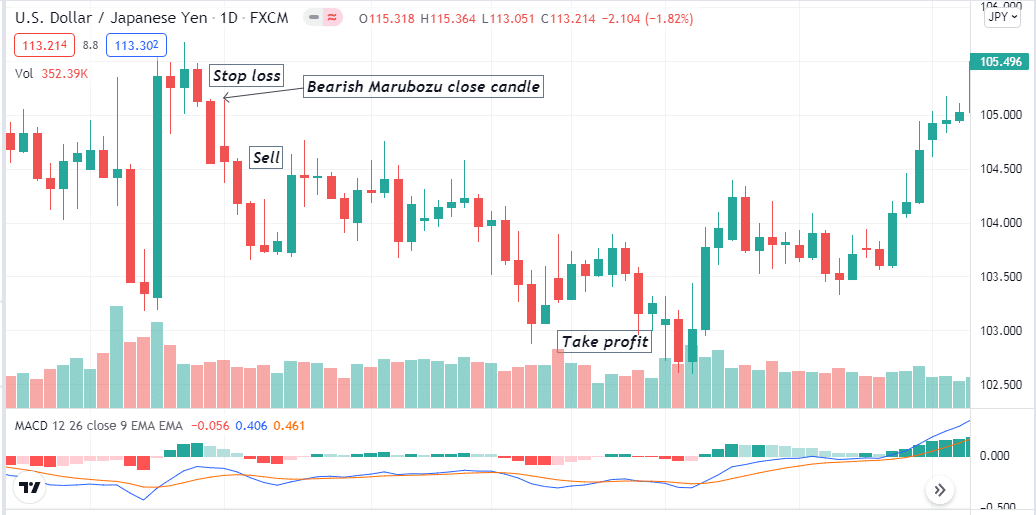
Entry
When these conditions above match with your target asset chart, place a sell order.
Stop loss
Place an initial stop loss above the bearish Marubozu candle.
Take profit
Close the sell order when:
- The volume indicator declares increasing buy volume.
- The dynamic blue line crosses above the dynamic red line.
- MACD green histogram bars take place below the central line.
Pros and cons
| Pros | Cons |
| Allow you to make trades in the direction of the current trend. | Making trades depending on only one candle is not very wise. |
| These are universal patterns that you can find on any financial asset chart. | The winning rate of this pattern is not satisfactory as the price often retraces back. |
| An easily identifiable pattern. | Require using other technical tools and indicators to execute trades using these patterns. |
Final thought
Finally, the Marubozu are potential patterns to make trading decisions. You need to follow the upper time frame charts to obtain the most potential. For example, you mark a bullish Maribozu pattern in the weekly chart of your target asset; then, you know the market sentiment so you can make buy orders on the lower time frame charts according to your trading strategies.