
There are many technical indicators available there for financial traders. For some indicators, the calculation method is a little different to obtain more accurate results. The Hull moving average or HMA is one of the remarkable among them.
However, when you want to use an indicator to make trading decisions, there is no alternative to learning the concept of this tool. This article is about the HMA, which also contains different trading strategies using this indicator besides listing the top pros and cons.
What is the Hull moving average?
The developer of this indicator is Alan Hull and the developing period is 2005. The tool is among directional indicators considering current market context than recent price action and historical data. This technical indicator is among the moving averages with different calculations than Simple moving average (SMA) or Exponential moving average (EMA). HMA involves reducing lags by prioritizing recent data. For a better understanding, look at the figure below.
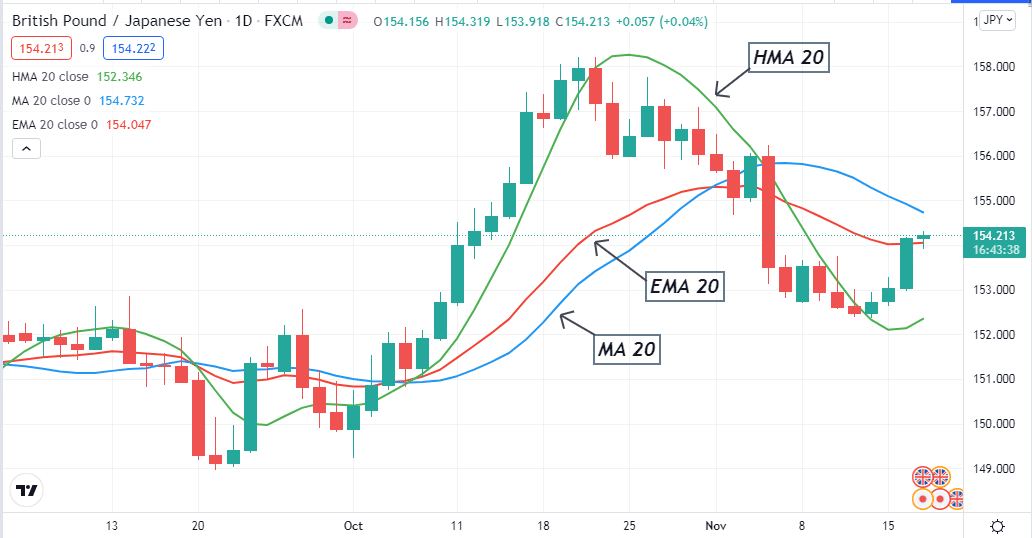
The green line is HMA (20), the red line is EMA (20), and the blue line is SMA (20). Three moving averages have the same value but appear in different ways with price changes. HMA is faster and more smooth than other moving averages. This indicator works with the Weighted moving average value, calculates data to reduce lags, and shows the market context according to calculations.
How to trade using the Hull moving average
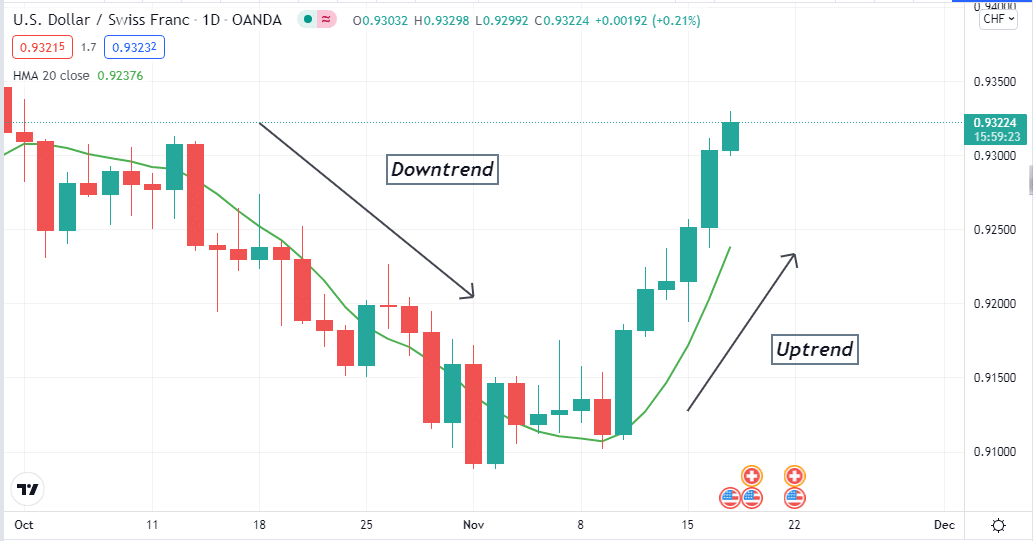
It is a unique moving average that is easily applicable to any trading asset. Trading using this technical indicator is comparatively easier than others. It suits any trading asset on any time frame. The trading concept is simple; it indicates a bullish environment when the HMA line slopes toward the upside. Conversely, when it is sloping downward, it means bearish pressure on the asset price.
You can use only HMA to generate trade ideas or combine them with other technical indicators or tools to identify more accurate trading positions.
A short-term trading method
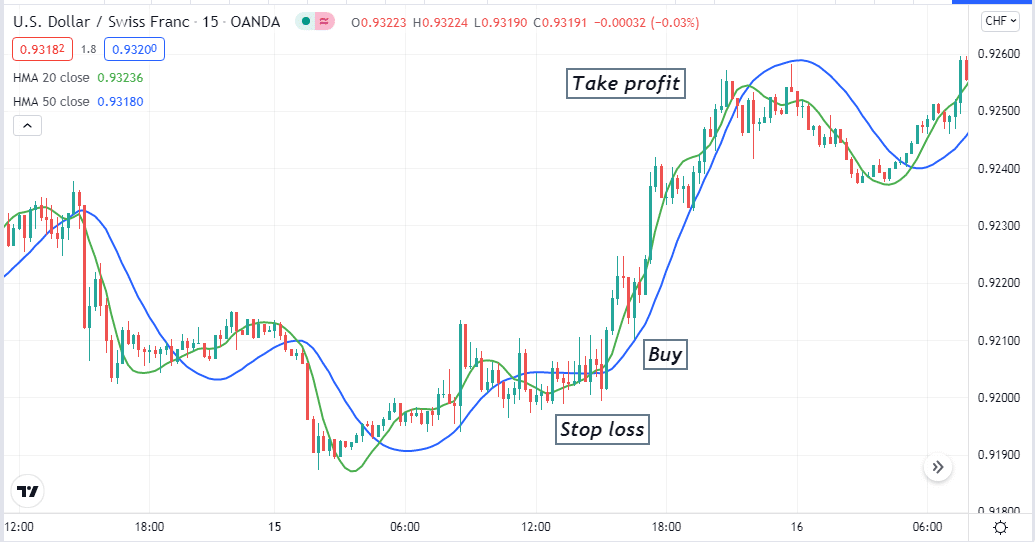
In our short-term trading method, we use two different periods moving averages to catch potential trading positions. We use HMA 20 and HMA 50 in this strategy. HMA 20 is green and HMA 50 is blue. The crossover between these HMA lines suggests entry/exit points of any trading position. This strategy suits fine on any timeframe; we recommend using 15 min or above timeframe to get the best results.
Bullish trade scenario
This strategy suggests buying positions when:
- The HMA 20 (green) line crosses the HMA 50 (blue) line on the upside.
- Both the HMA (20) and HMA (50) lines are moving toward the upside.
Entry
When the conditions above match with the target asset chart, it indicates buyers dominate the asset price. Wait till the current bullish candle closes and place a buy order.
Stop loss
The stop loss level for your buy order will be below the current swing low.
Take profit
Continue the buy order till the price remains on the current trend. Close the buy position when the green EMA line crosses the blue EMA line on the downside.
Bearish trade scenario
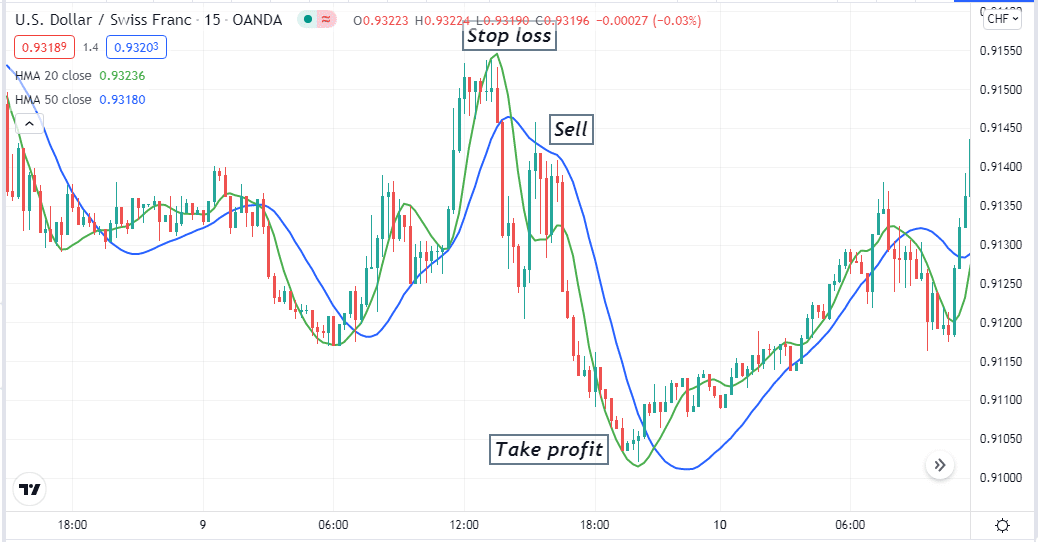
This strategy suggests selling positions when:
- The HMA 20 (green) line crosses the HMA 50 (blue) line on the downside.
- Both the HMA (20) and HMA (50) lines are moving toward the downside.
Entry
When the conditions above match with the target asset chart, it indicates sellers dominate the asset price. Wait till the current bearish candle closes and place a sell order.
Stop loss
The stop loss level for your sell order will be above the current swing high.
Take profit
Continue the sell order till the price remains on the current trend. Close the sell position when the green EMA line crosses the blue EMA line on the upside.
A long-term trading method
Our long-term trading method involves using another popular technical indicator, the RSI; besides HMA, we use HMA 20 in this strategy. This trading method applies to many financial assets such as commodities, forex pairs, stocks, etc. You can use this trading technique on any time frame chart: we suggest using an H4 or daily chart to get the best results.
Bullish trade scenario
After applying both indicators, observe the chart when:
- Price crossed above the HMA 20.
- The HMA 20 is sloping toward the upside.
- The dynamic line of the RSI window is at or above the central (50) line and moving toward the upside.
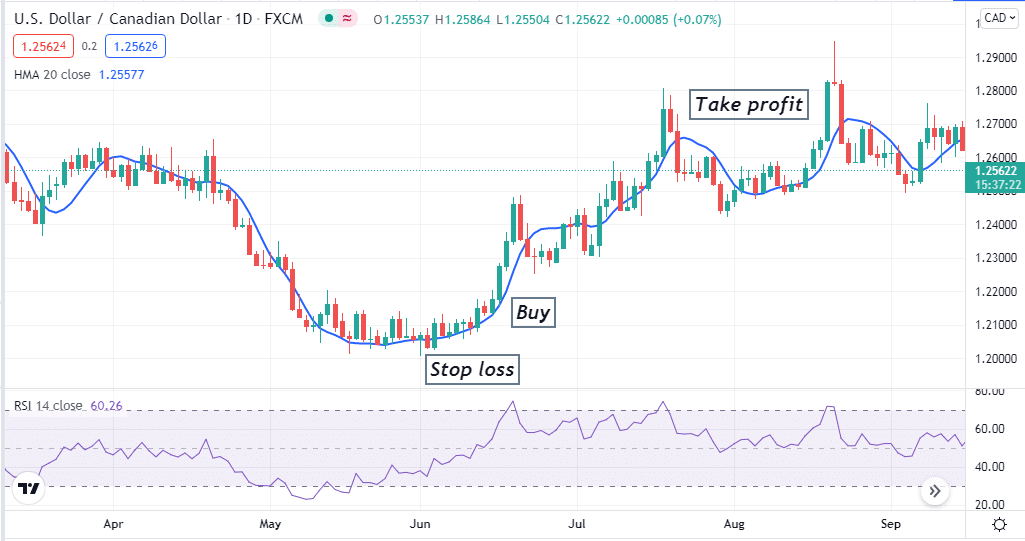
Entry
When these conditions above match the target asset chart, place a buy order.
Stop loss
Set an initial stop loss for your buy order below the current swing low.
Take profit
Close the buy order when:
- Price crosses below the HMA line, and HMA starts to slope toward the downside.
- The dynamic line on the RSI window returns at or near the central (50) line after reaching the upper (80) line.
Bearish trade scenario
After applying both indicators, observe the chart when:
- Price crosses below the HMA 20.
- The HMA 20 is sloping toward the downside.
- The dynamic line of the RSI window is at or below the central (50) line and moving toward the downside.
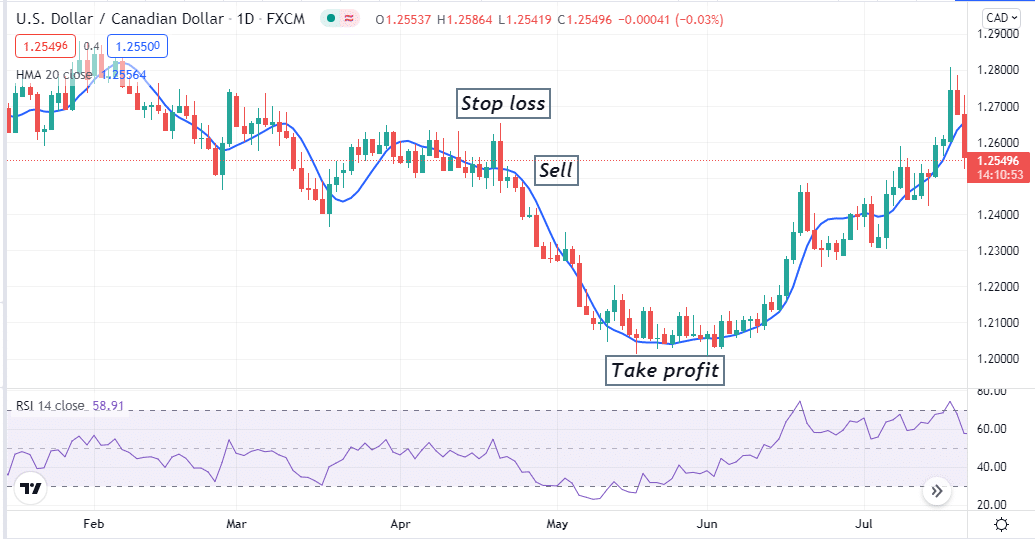
Entry
When these conditions above match the target asset chart, place a sell order.
Stop loss
Set an initial stop loss for your sell order above the current swing high.
Take profit
Close the sell order when:
- Price crosses above the HMA line, and HMA starts to slope toward the upside.
- The dynamic line on the RSI window returns at or near the central (50) line after reaching the lower (20) line.
Pros and cons
| Pros | Cons |
| Easily applicable. | This indicator can fail due to volatility. |
| Allow trading many financial assets. | This indicator can fail due to significant news releases. |
| This indicator is faster and smoother than other moving averages. | Generates trade ideas depending on technical data while ignoring many other fundamental price-changing factors. |
Final thought
Finally, HMA is a unique moving average that enables traders to execute constantly profitable trades. We suggest practicing these trading methods on demo trading to master the concept before executing live trades.