
The Linearly Weighted Moving Average of LWMA belongs to the MA indicator family that weights significantly on the recent price movement data when showing results. Many financial investors prefer this technical indicator instead of other moving averages. So no wonder crypto investors also can generate constantly profitable trading ideas using thetradin.
However, using any technical indicator to determine optimal trading positions requires having a particular level of understanding to obtain the best results. This article enlightens the LWMA indicator alongside describing sustainable trading strategies using this indicator with chart attachments for a better understanding.
What is the LWMA indicator?
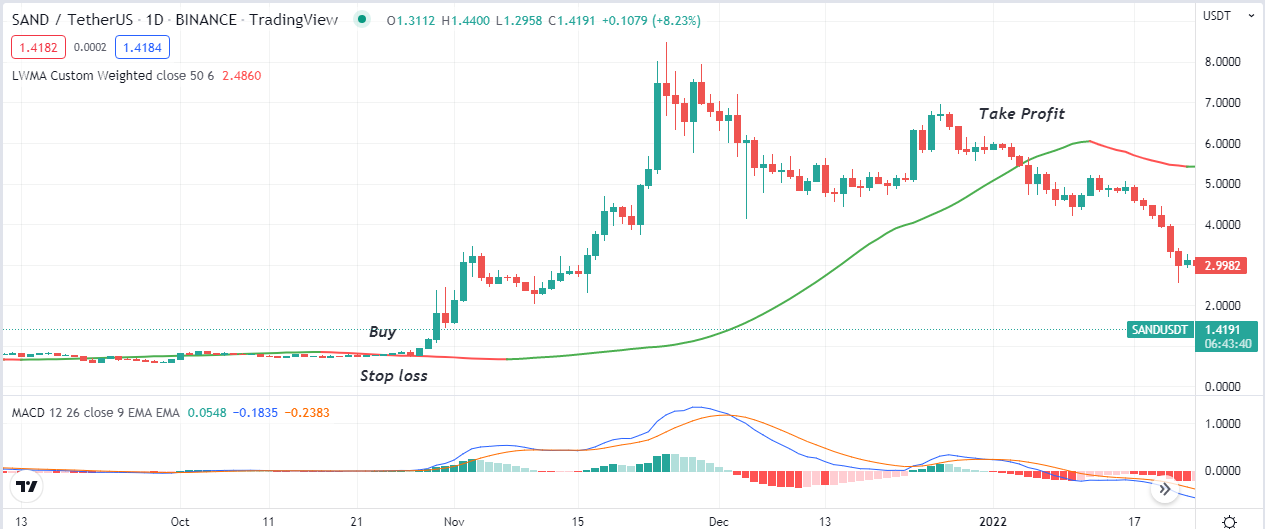
This tool uses the same concept as other moving averages like SMA or EMA. The primary difference is this indicator puts more weight on the recent price movement data through its unique calculation. LWMA indicator usually responds quicker than other indicators of the same group, such as SMA or EMA. Meanwhile, it uses the formula below.
Now you get a clear concept of the LWMA indicator calculation. You can change the parameters as you prefer. Additionally, you can use this indicator to detect trends, trend reversal points, support resistance levels, etc.
How to trade crypto using the LWMA indicator?
LWMA is an easily applicable indicator; you can apply it to many financial assets. Although the calculation is different, the usability features are similar to other MA indicators. You can use a single LWMA line or two or more lines to utilize the crossover concept.
For example, you can use an LWMA (30) line when the price goes above the LWMA line suggesting bullish pressure and vice versa. Again, you can use two different LWMA lines (LWMA 10 and LWMA 20).
When the LWMA indicator with a lower parameter value surpasses the LWMA of significant value on the upside, it declares a positive force on the asset price and vice versa.
Short-term trading strategy
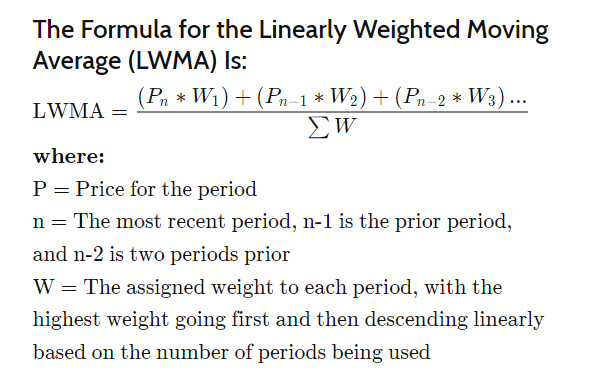
We use the MA crossover concept in this trading method through two LWMA lines alongside the parabolic SAR. This method involves using the LWMA 10 (red) and LWMA 20 (blue). The crossover between these lines declares the trend-changing points.
Meanwhile, the parabolic SAR confirms the momentum. So it becomes easier to determine trading positions by combining both indicator readings. This method suits many trading instruments on different timeframe charts; the preferable charts are H1 or 15 min to generate short-term trade ideas. It is better to check the upper time frame charts to confirm the actual trend before entering when using these charts.
Bullish trade scenario
Apply those indicators to your target asset chart and seek to open buy positions when the scenarios below appear:
- The red LWMA line surpasses the blue LWMA line on the upside.
- The parabolic SAR dots occurs below price candles and start making a series.
Entry
When these conditions above match your target asset chart, it declares an initiation of a bullish trend. Enter a buy order.
Stop loss
The initial stop loss for your buy order will be below the current swing low with a buffer of 5-10 pips.
Take profit
Close the buy position by matching the conditions below:
- The red LWMA line crosses below the blue LWMA line.
- The parabolic SAR dots flip on the upside of price candles.
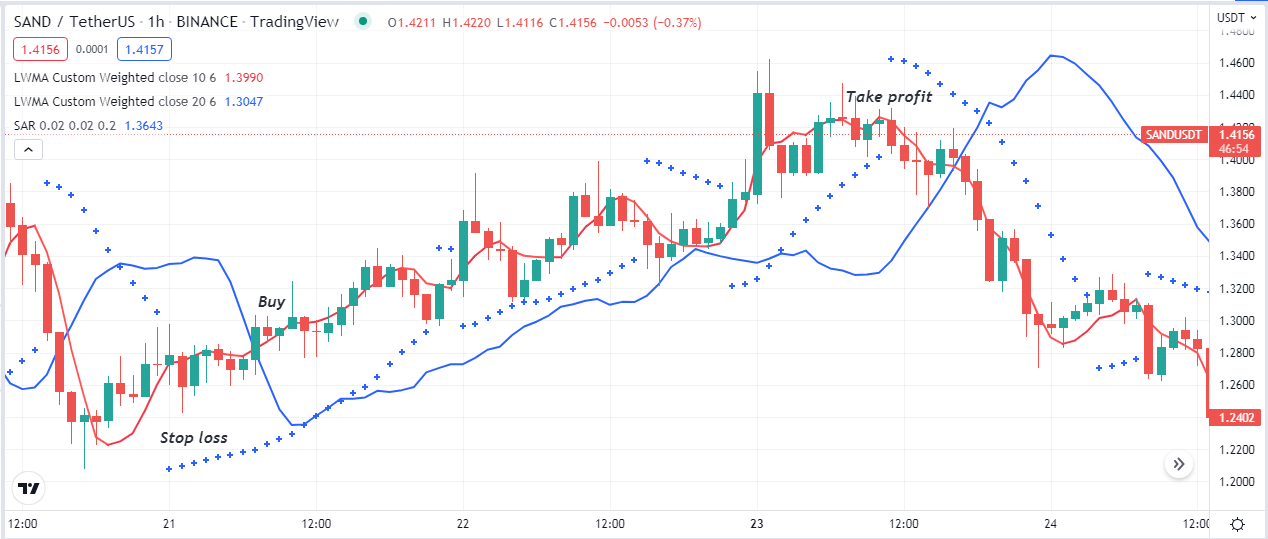
Bearish trade scenario
Apply those indicators to your target asset chart and seek to open buy positions when the scenarios below appear:
- The red LWMA line surpasses the blue LWMA line on the downside.
- The parabolic SAR dots occurs above price candles and start making a series.
Entry
When these conditions above match your target asset chart, enter a sell order.
Stop loss
The initial stop loss will be above the current swing high with a buffer of 5-10 pips.
Take profit
Close the sell position by matching the conditions below:
- The red LWMA line crosses above the blue LWMA line.
- The parabolic SAR dots flip on the downside of price candles.
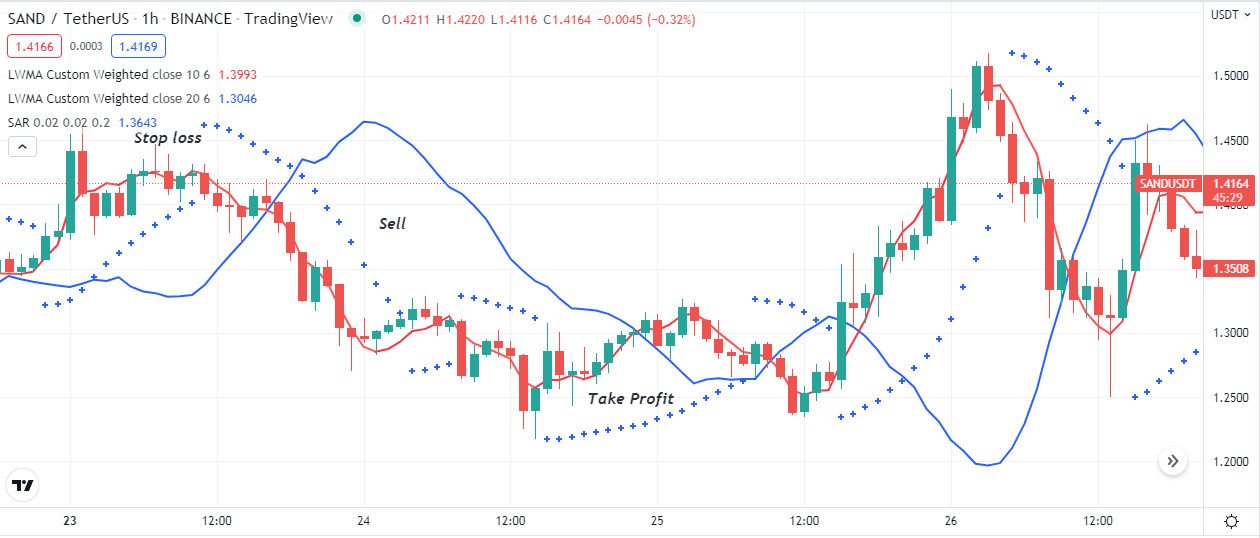
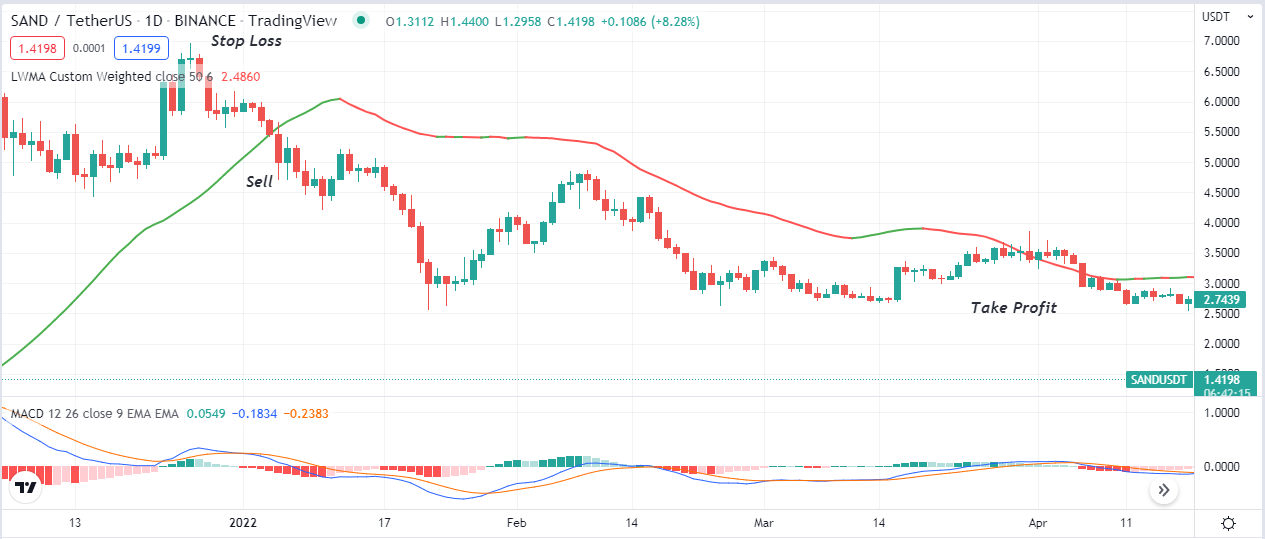
Long-term trading strategy
This trading method uses a popular technical indicator, the moving average convergence/divergence MACD, alongside an LWMA (50) signal line. The MACD indicator shows results in an independent window containing two dynamic signal lines and histogram bars of different colors on both sides of a central (50) line. The idea is to combine both indicator readings to determine trading positions. We recommend using this method on a D1 or H4 chart to detect trades’ most potent long-term entry/exit points.
Bullish trade scenario
This method suggests opening buy positions when the scenarios below occur:
- The price reaches above the LWMA line.
- The dynamic blue line gets above the red line.
- MACD green histogram bars take place above the central (50) line.
Entry
Match these conditions above and execute a buy order.
Stop loss
Set an initial stop loss below the current bullish momentum.
Take profit
Close the buy order when the scenarios below occur:
- The price reaches below the LWMA line, and the LWMA line starts sloping on the downside.
- The dynamic blue line reaches below the dynamic red line at the MACD indicator window.
- MACD red histogram bars take place below the central (50) line.
Bearish trade scenario
This method suggests opening sell positions when the scenarios below occur:
- The price reaches below the LWMA line.
- The dynamic blue line gets below the red line.
- MACD red histogram bars take place below the central (50) line.
Entry
Match these conditions above and execute a sell order.
Stop loss
Set an initial stop loss above the current bearish momentum.
Take profit
Close the sell order when the scenarios below occur:
- The price reaches above the LWMA line, and the line starts sloping on the upside.
- The dynamic blue line reaches above the dynamic red line at the MACD indicator window.
- MACD green histogram bars take place above the central (50) line.
Pros and cons
| Pros | Cons |
|
|
|
|
|
|
Final thought
Finally, the LWMA indicator is a potential technical indicator to generate trade ideas on many trading instruments, including cryptocurrencies. We suggest following proper trade and money management rules while using this indicator to execute trades on live accounts.


