
Financial traders use many technical indicators to obtain the market context. These technical indicators and tools are reliable in many ways to predict the future price movement besides identifying the most accurate trading positions. The Chaikin money flow indicator is so popular among financial traders.
This article will introduce you to the Chaikin money flow indicator. However, it is mandatory to understand the features and components of the indicator to use for successful trading. Later, we list this indicator’s top pros and cons to reveal its potentiality. Moreover, we will explain successful trading methods with chart attachments to understand better.
What is the Chaikin money flow indicator?
The Chaikin money flow indicator is a technical indicator that estimates the money flow volume on a particular period and shows that in an independent window. The developing period of this indicator was in the 1980s by Marc Chaikin. This indicator uses a standard parameter or 20 or 21 to determine the buying or selling pressure on the asset price during any particular period. The closing price is relative to the high during an accumulation phase, and conversely, the closing price is nearer to the low when the distribution phase takes place.
The CMF indicator is involved in three types of calculations:
- Money flow multiplier calculating equation:
Money flow multiplier = [(Close price – Low price) – (High price – Close price)] / (High – Low)
- Money flow volume equation:
Money flow volume = Money flow multiplier x Volume for the period
- Specific period equation:
20-Period CMF = 20-Period sum of money flow volume / 20-Period sum of the volume
How to identify the market context and use the CMF indicator?
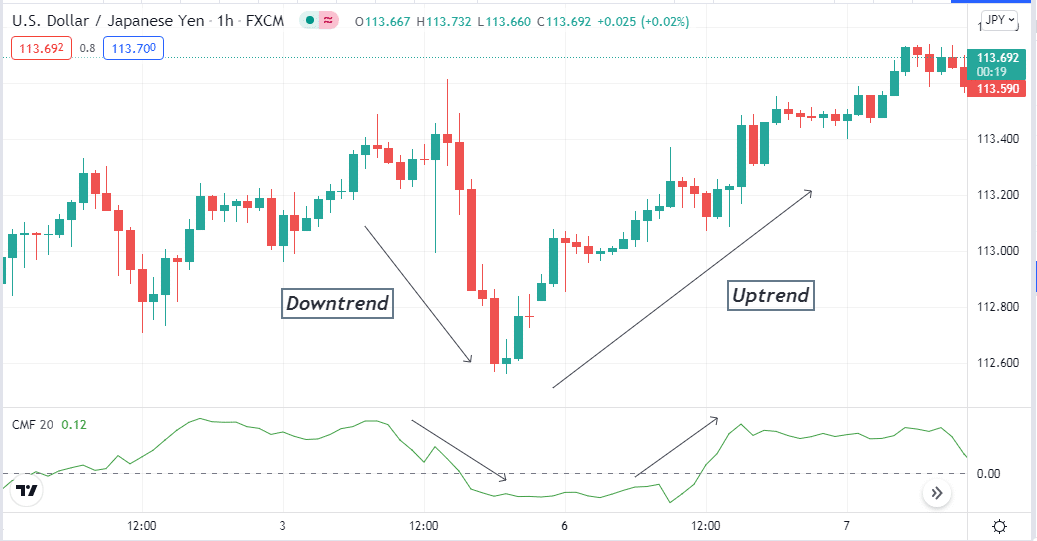
It requires understanding the indicator components to anticipate the market context. The CMF window has a central (0.0) line and a dynamic line with the price movements. When the dynamic line reaches above the central line, it declares an accumulation phase or sufficient bullish pressure on the asset price.
Inversely, the dynamic line below the central (0.0) line indicates a distribution phase or an increasing declining pressure. So the CMF is an easily applicable indicator that suits many trading assets such as currency pairs, commodities, stocks, indices, crypto assets, etc.
You can use it as a standalone indicator or combine it with other technical indicators or tools to generate precious trading ideas. For example, you can use it with the RSI indicator. When a bullish momentum comes up, the CMF line crosses above the central (0.0) line. Meanwhile, the RSI dynamic line crosses above the central (50) line, indicating sufficient bullish pressure on the asset price and generating a buy signal.
A short-term strategy
We use the support resistance concept alongside the CMF indicator to determine short-term trading positions in this trading method. As it is a short-term trading method, we recommend using a 15-min chart. Meanwhile, draw the support resistance levels using upper time frames besides priority the weekly, monthly high-low, open-close levels. Cause these are the levels where price movement shifts to other direction.
Bullish trade setup
When the price reaches any support level, seek to place buy orders when:
- The price breaks above any of the prior levels that you draw.
- The CMD value rises above the central line.
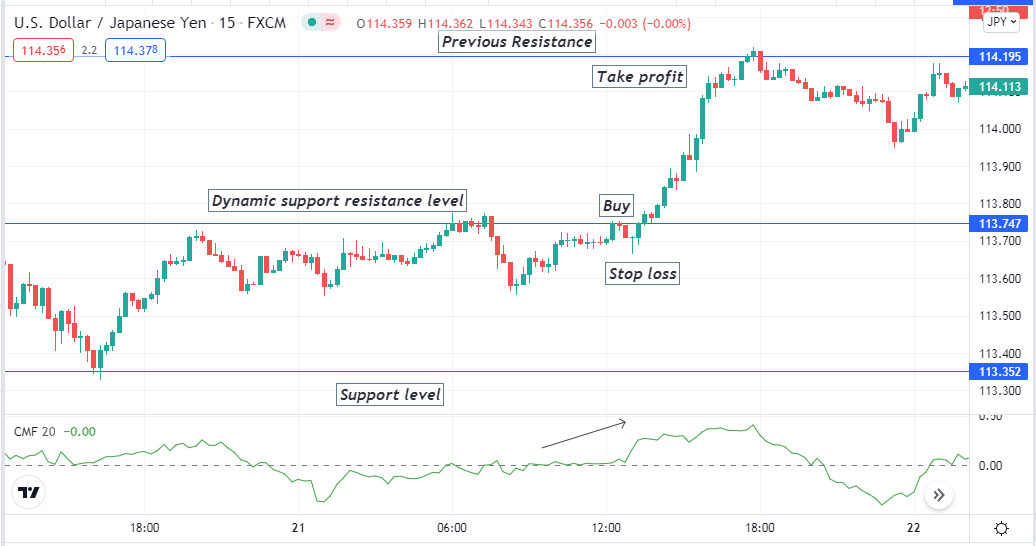
Entry
Match these conditions above; it declares a bullish momentum, placing a buy order.
Stop loss
Place a reasonable stop loss below the breakout level.
Take profit
The initial profit target will be below the nearest resistance level. Otherwise, you can carry the buy order till the bullish momentum continues. Close the buy order when the CMF indicator declines below the central (0.0) line.
Bearish trade setup
When the price reaches any resistance level, seek to place sell orders when:
- Check the price breaks below any of the prior levels that you draw.
- The CMD value declines below the central (0.0) line.
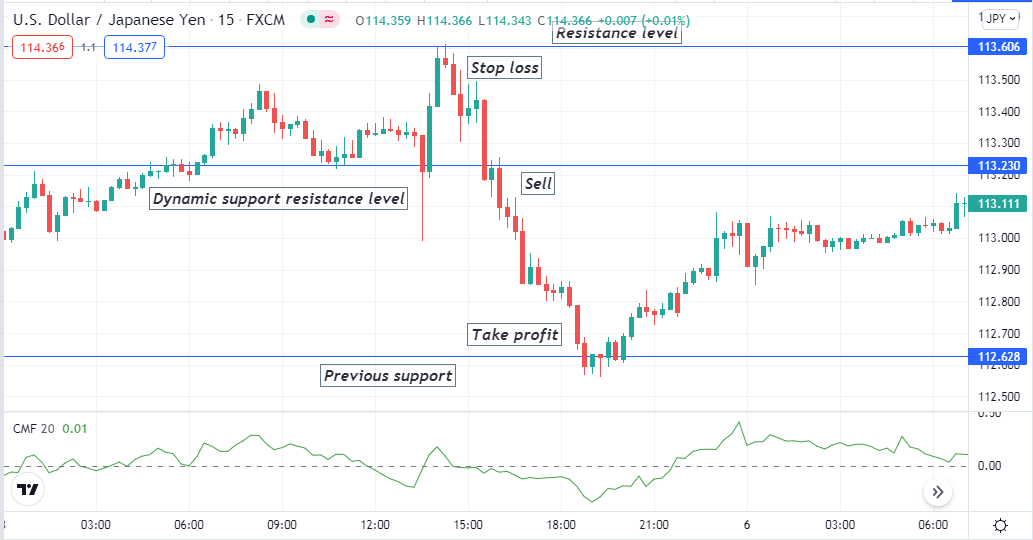
Entry
Match these conditions above; it declares a bearish momentum. Then open a sell order.
Stop loss
Place a reasonable stop loss above the breakout level.
Take profit
The initial profit target will be above the nearest support level. Otherwise, you can carry the sell order till the bearish momentum continues. Close the sell order when the CMF indicator rises above the central (0.0) line.
A long-term strategy
This trading method contains another popular technical indicator, the MACD, besides the CMF indicator. When both indicators declare bullish momentum, place buy orders, and conversely, when both indicators indicate declining pressure, place sell orders. We recommend using this method on an H4 or above timeframe chart to catch long-term trades.
Bullish trade setup
Seek to place buy orders when
- The CMF value rises above the central (0.0) line declaring an accumulation phase.
- The dynamic blue line crosses above the dynamic red line in the MACD window.
- MACD green histogram bars take place above the central line.
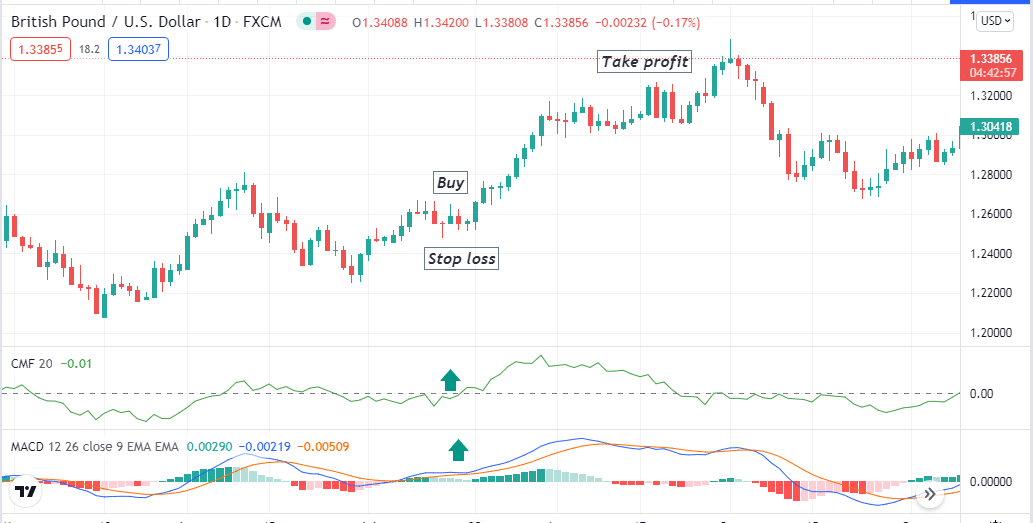
Entry
Match these conditions above and place a buy order.
Stop loss
The reasonable stop loss will be below the current swing low level.
Take profit
Close the buy order when
- The CMF value declines below the central (0.0) line.
- MACD red histogram bars take place below the central line.
Bearish trade setup
Seek to place sell orders when:
- The CMF value declines below the central (0.0) line declaring a distribution phase.
- The dynamic blue line crosses below the dynamic red line in the MACD window.
- MACD red histogram bars take place below the central line.
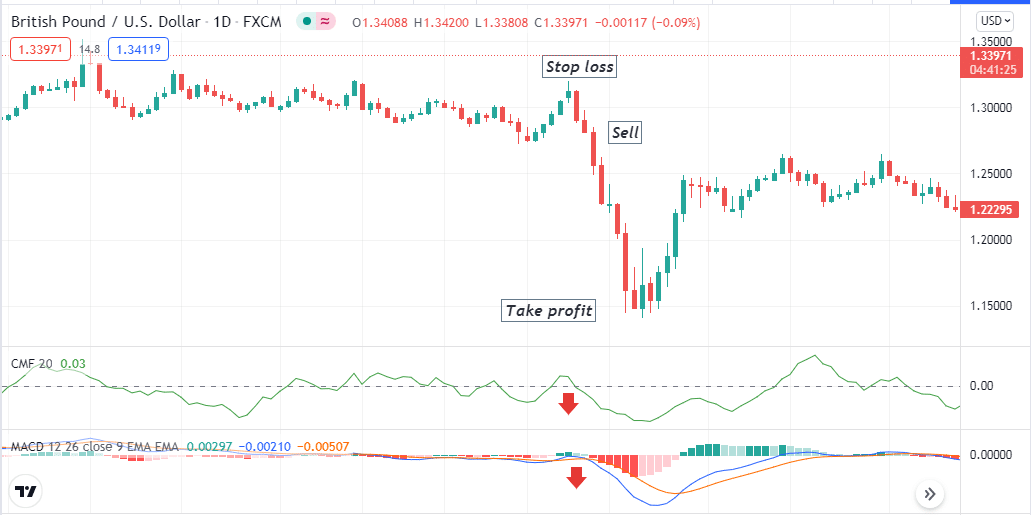
Entry
Match these conditions above and place a sell order.
Stop loss
The reasonable stop loss will be above the current swing high level.
Take profit
Close the sell order when:
- The CMF value rises above the central (0.0) line.
- MACD green histogram bars take place above the central line.
Pros & cons
| Pros | Cons |
| This indicator supports the price action concept. | This indicator can fail due to fundamental reasons. |
| The CMF indicator applies to many trading assets. | The CMF indicator doesn’t suggest a complete trade setup. |
| The CMF indicator allows making both short-term and long-term trades. | Using the CMF indicator as a standalone indicator is not a wise decision. |
Final thought
Finally, the CMF indicator is a potential indicator that suggests trades according to price action concepts. For financial traders who use the smart money concept for trading, the CMF indicator can be beneficial. Using this indicator wisely, you can easily make thousands of pips per month using CMF.