
The Nasdaq 100 Total Return Index is a solid passive investment opportunity that tracks the world’s Nasdaq 100 index performance. This fund consists of low-risk latency, lower cost, and superior return that might influence you to keep this investment opportunity on your priority list.
Within the Nasdaq 100, we will find the world’s top-rated tech companies dominating a significant part of the global shares. Moreover, after the Covid-19 pandemic, people became aware of using technology more than before. Therefore, investing in an index fund that tracks the world’s most renowned tech companies might be a solid way to make money.
However, before injecting your money, you should research how the funds are opening, risk tolerance, volatility measurement, and price anticipation. So let’s check out our picks on the Nasdaq 100.
What is the Nasdaq 100 Total Return Index?
It is the combination of mutual funds and ETFs that track the performance of an index. For example, the Nasdaq 100 tracks the performance of 102 world’s biggest tech companies listed in the Nasdaq. Moreover, it considers the assumption before cash distribution is reinvested and tracks the component’s price movement.
The index is considered the home of the world’s major innovative companies, including Google, Tesla, Apple, and Microsoft. These iconic brands collaborate with Nasdaq and grow together in the capital, business, and ideas.
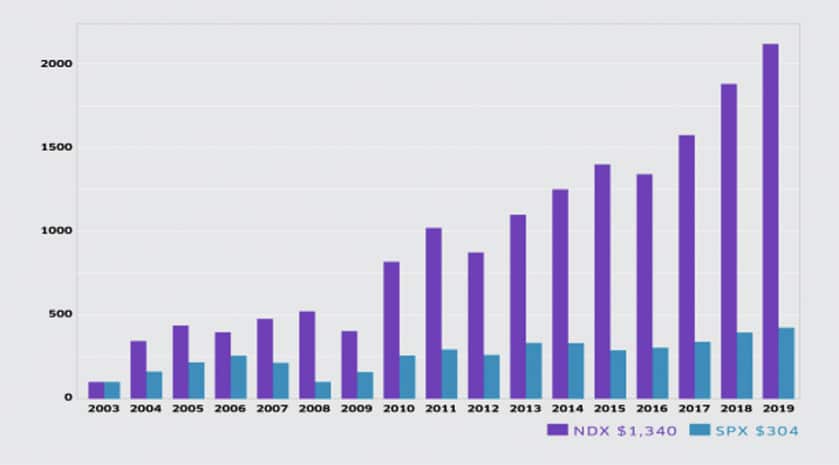
This fund is an attractive investment opportunity as it shows more return than the S&P 500 index. Considering the last 13 years’ performance, we would see that the Nasdaq 100 has outperformed S&P in 11 of 13 years.
History of fund
Nasdaq 100 initiated the operation on 31 January 1985 with Nasdaq 100 and Nasdaq Financial 100. Between these, Nasdaq 100 tracks the industrial-technological, retail, and telecommunication sectors’ performance while Nasdaq Financial tracks the performance of banks, insurance sectors, and mortgage loan companies.
In the formation, the Nasdaq 100 price was set to 250 level and reached 800 on 31 December 1993. On that date, the index was reset its price to 125 to make it below the Nasdaq Composite Index. Later on, foreign companies started to join this index in 1998; it combines the 102 tech companies holding leading positions in the world.
Rankings
Nasdaq 100 is a small part of the Nasdaq composite index consisting of 3000 companies, including tech and financials. As the Nasdaq 100 is a tiny portion of the overall composite index, no ranking and rating information is available.
Trailing total returns
It is an important metric to understand how much profit an index fund is providing. The trailing return may vary with the investment type and time frame.
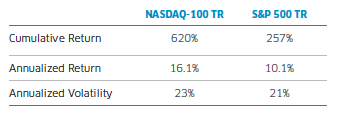
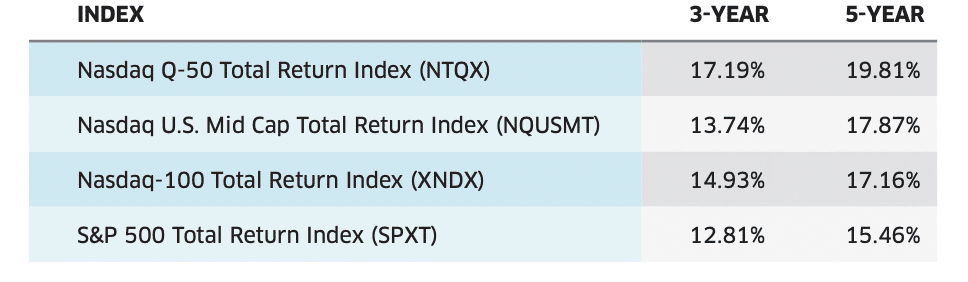
Nasdaq 100 has provided higher returns annually compared to returns from the S&P 500 index. The annual return from this index came at 16%, while for the S&P 500, it is 10.1%.
Performance
The Nasdaq 100 index focuses on the top-performing tech companies that outperformed the S&P 500 by a large margin. Since its formation, it has provided 199% more profit than the S&P index, making it an attractive investment.
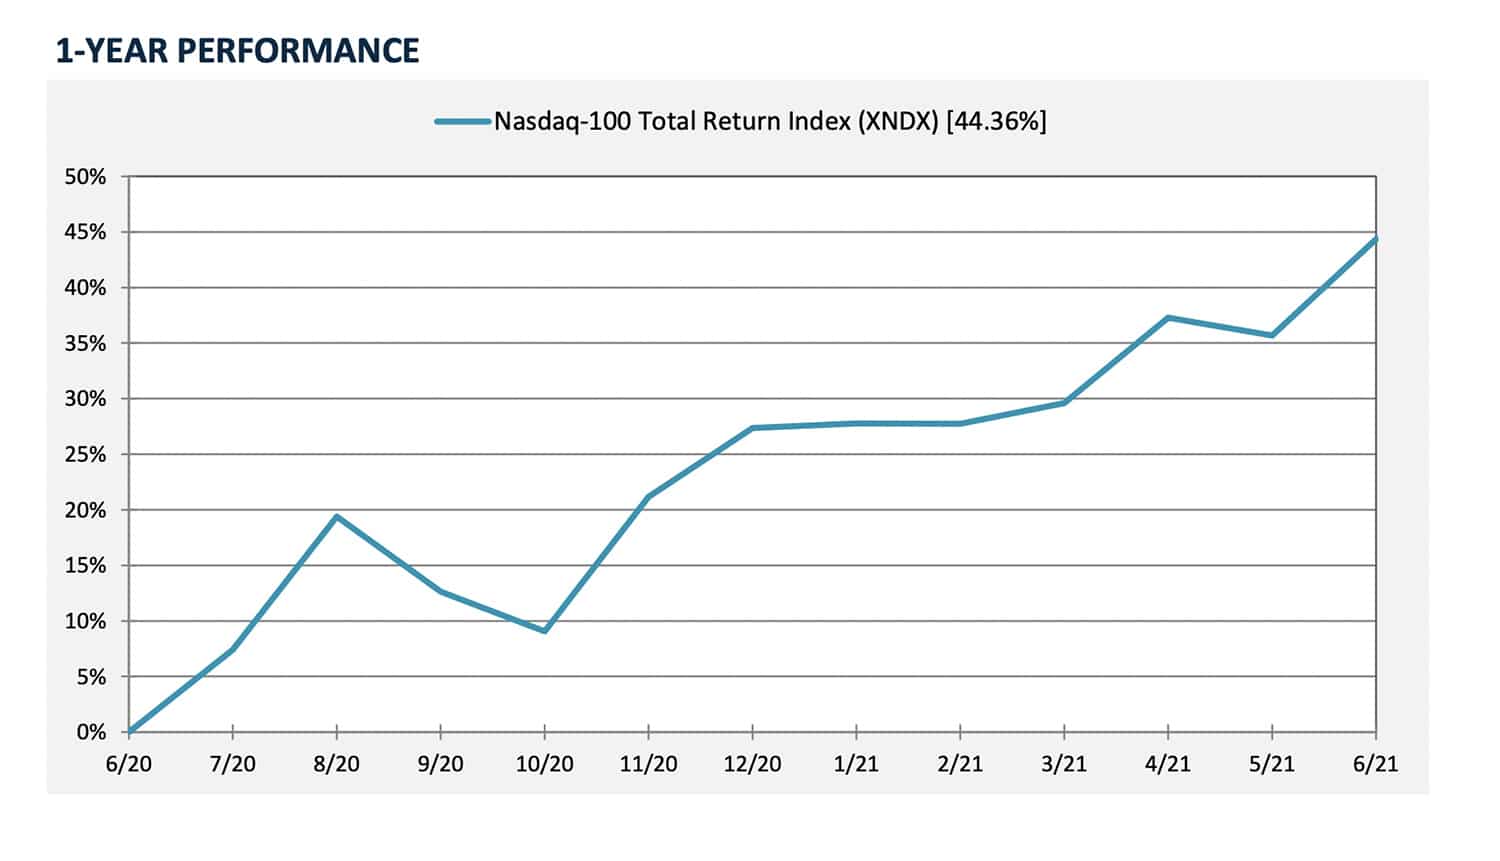
The figure above is a growth chart of the Nasdaq 100 index for the last 12 months. Again, we can see that the overall performance was higher than an average 45% return in one year.
Let’s see the revenue compared with the S&P 500 index and Nasdaq 100 index.
Fees
There are the many US and non-US mutual funds and ETFs that track the performance of the Nasdaq 100 index. Among them, QQQ is an ETF that offers trading with a lower trading fee and management cost.
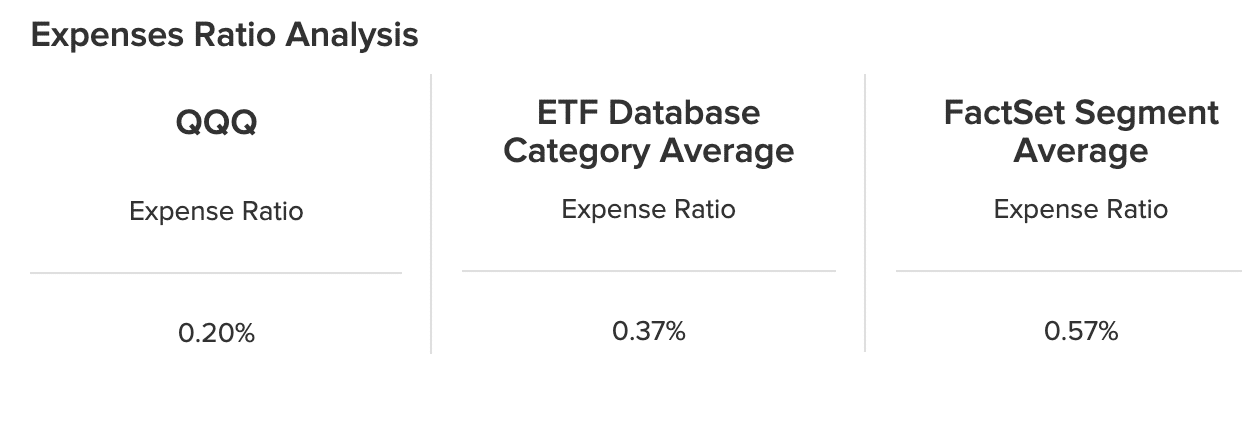
As per the above image, we can see that the expense ratio for QQQ is at 0.20%, which is significantly lower than the industry average.
Risks and holdings
There is no investment without the risk of losing the principal. Each fund is not diversifiable, and you cannot eliminate the risk at all. As the Nasdaq 100 tracks the performance of top tech companies in Nasdaq, its risk depends on how technology companies perform.
During the Covid-19 pandemic, investors have suffered substantial collapse due to the lockdown, while tech stocks have experienced a historic low. However, people became aware of the business activities from home that influenced tech stocks to boom.
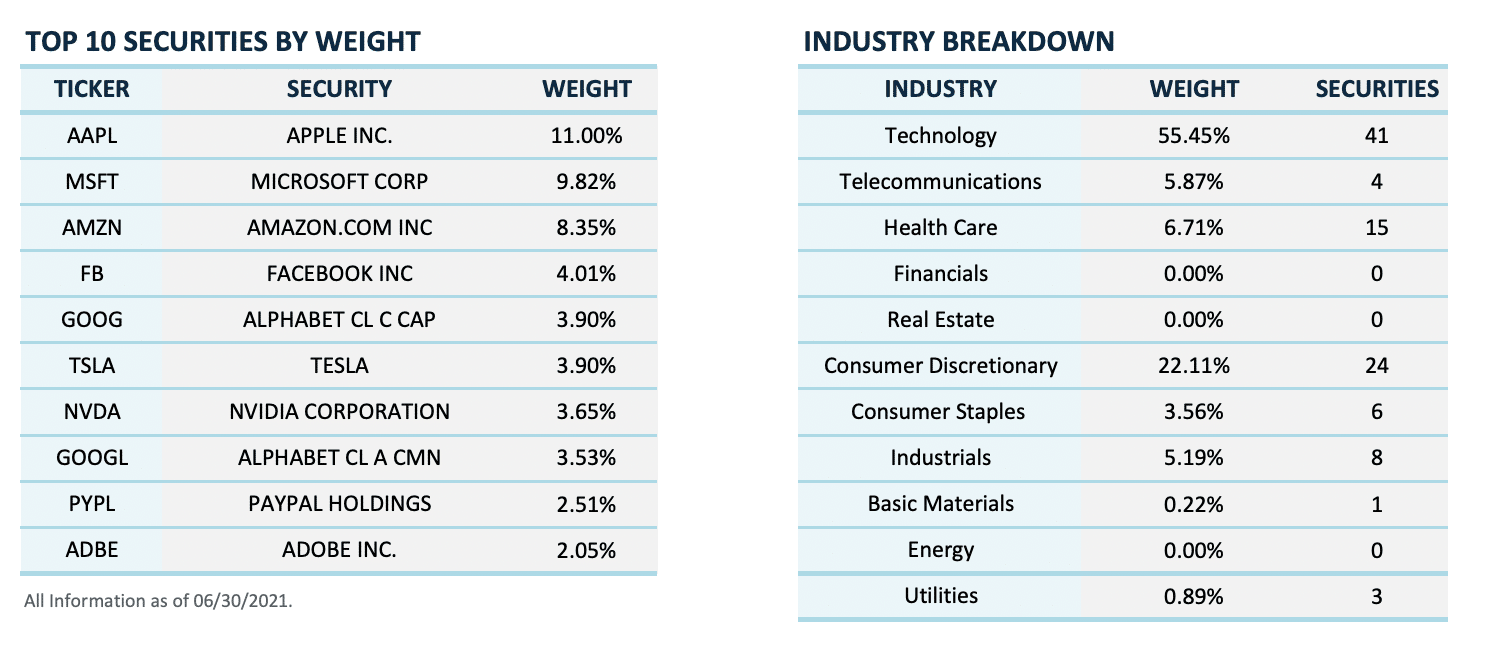
In the Nasdaq-100 holdings, tech stocks have almost 55.45% market weight, including giant Apple, Microsoft, and Amazon.
Volatility measurements
The Nasdaq 100 total return index is higher volatile than the S&P 500 total return index by almost 2%. If we compare the volatility of some well-known indexes, we will find a chart like this.
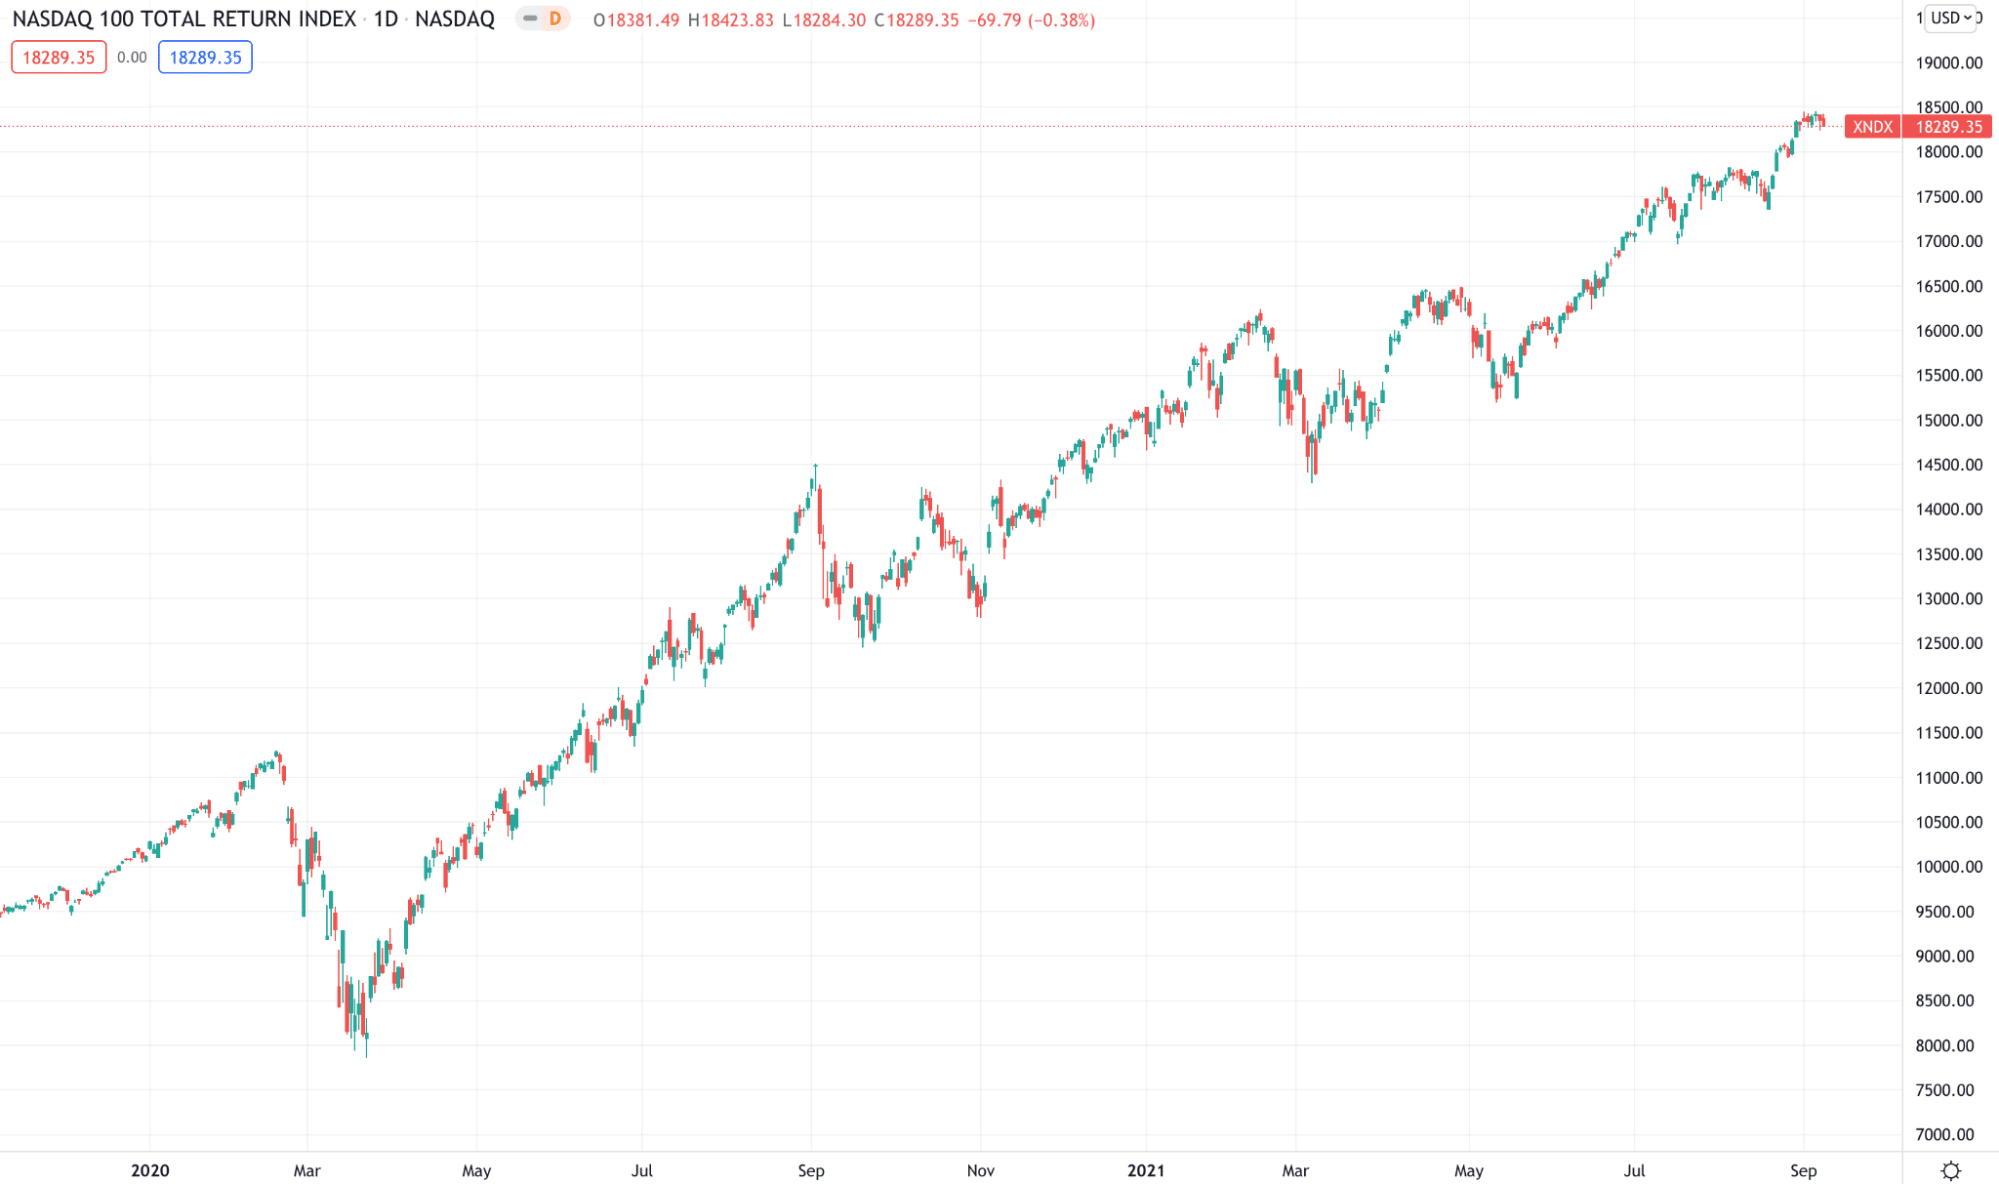
Nasdaq 100 total return index 2022 forecast
We have observed the performance of the Nasdaq 100 index by closely monitoring the volatility, cost, fees, historical performance, etc. Based on our findings, the XTRX showed an amazon performance in the last few years, where the previous year it provided nearly 44% return. Therefore, considering the past and post-pandemic performance of tech stocks, we can anticipate a positive price development for this index.
Final thought
Now you know all the basics about the Nasdaq 100 Total Return Index, which is an attractive investment opportunity for passive investors. The best method to invest in this index is through mutual funds and ETFs.
However, the market return depends on how investors manage risks by following a good trading strategy. If you are not an expert in individual stock trading, taking part in this index would be a good option for you.

