 Crypto Strategy: How to Master?")
Range bound trading allows investors to execute trades from the support resistance levels. The RBCI is a unique technical indicator that helps investors participate in the most potential trades. So it makes sense that crypto investors consider this technical indicator an efficient tool while making trade decisions.
However, it requires a clear understanding of any particular indicator while using it for successful crypto trading. This article will dive into the indicator and describe successful crypto trading strategies using this indicator with chart attachments for a better understanding.
What is the Range Bound Channel Index (RBCI) indicator?
It is the tool that uses a channel filter calculation (CF). This indicator usually filters the market context depending on the slow adoptive trendline (SATL) and fast adoptive trendline (FATL).
It requires at least 55 bars to calculate subtracting SATL from FATL, and it shows readings in an independent window containing a dynamic line and two different zones. Crypto investors follow the dynamic line at specific zones to obtain the market context and make trade decisions.
How to use RBCI for crypto trading?
This tool is straightforward, and it became popular with crypto investors for its easily applicable feature. Another attractive feature is the zones of this indicator are dynamic, fluctuate depending on participants’ actions, and utilize calculations to define the market context. When the dynamic line reaches the green zone, investors usually expect bullish pressure on the asset price.
Meanwhile, near the red zone indicates an upcoming declining pressure on the asset price. The vital fact is the price can remain at overbought or oversold levels for a certain period depending on several factors, including time duration, participants’ actions, etc. You can utilize this concept to generate constantly profitable crypto trading ideas.
Short-term trading strategy
The parabolic SAR is a popular indicator for financial traders as it follows the price movements and detects swing highs/lows besides determining trends. We use the parabolic SAR as a supportive indicator alongside the RBCI indicator in this trading method. Combining the parabolic SAR and the RBCI indicator makes it easier to identify profitable trade setups. We recommend using this strategy in a 15 min or hourly chart to catch the best short-term trades.
Bullish trade scenario
When seeking to open buy positions, observe the readings of the indicators as below:
- The dynamic line of the RBCI indicator is near the green zone and heads on the upside.
- The parabolic SAR dots take place below price candles and start making a series.
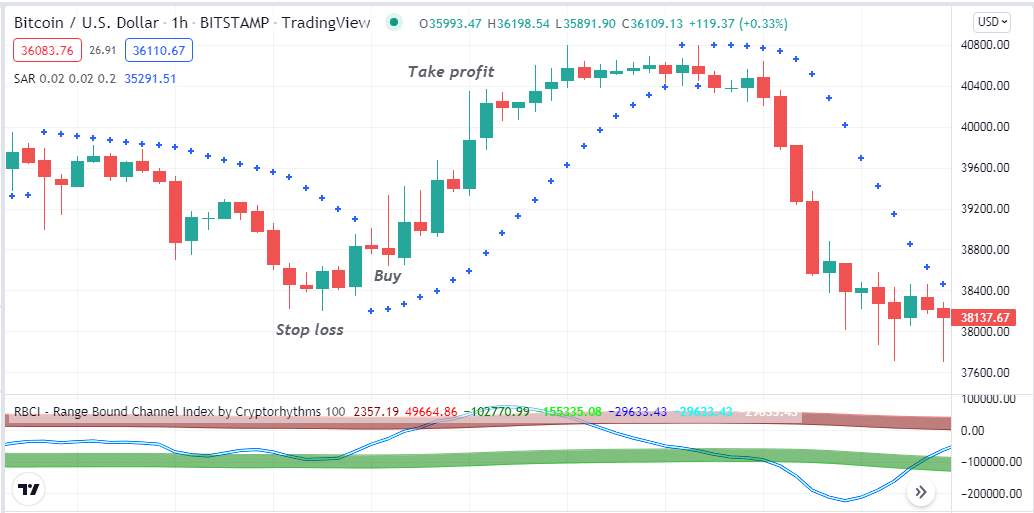
Entry
Match these conditions above and enter a buy trade.
Stop loss
The initial stop loss level will be below the recent swing low with a buffer of 5-10 pips.
Take profit
You may continue the buy order till the price continues to rise. Close the buy order by matching the conditions below:
- The RBCI dynamic line reaches the red zone or above.
- The RBCI dynamic line starts declining after reaching the red zone.
- The parabolic SAR dots switch on the upside of price candles.
Bearish trade scenario
When seeking to open sell positions, observe the readings of the indicators as below:
- The dynamic line of the RBCI indicator is near the red zone and heads on the downside.
- The parabolic SAR dots take place above price candles and start making a series.
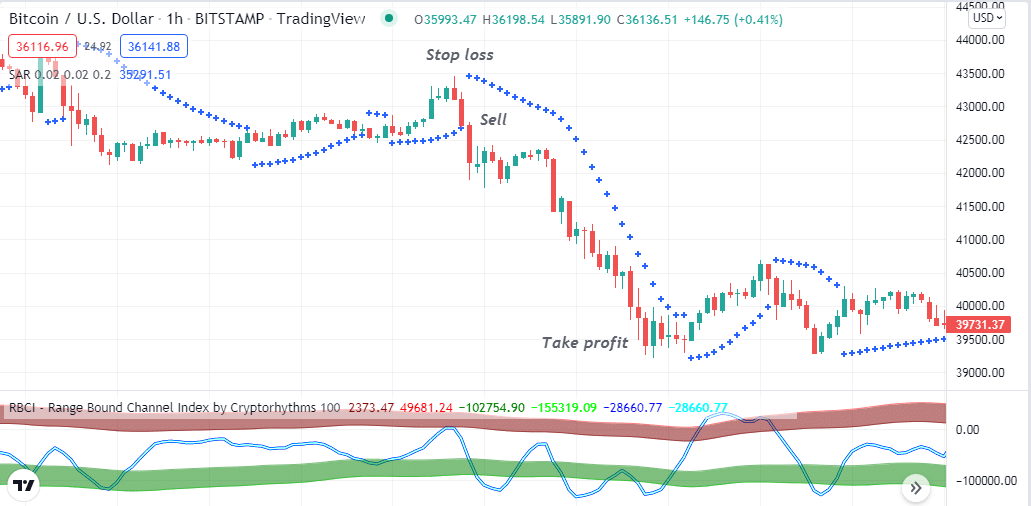
Entry
Match these conditions above and enter a sell trade.
Stop loss
The initial stop loss level will be above the recent swing high with a buffer of 5-10pips.
Take profit
You may continue the sell order till the price continues to decline. Close the sell order by matching the conditions below:
- The RBCI dynamic line reaches the green zone or below.
- The RBCI dynamic line starts rising after reaching the green zone.
- The parabolic SAR dots switch on the downside of price candles.
Long-term trading strategy
We combine the RBCI reading with an HMA line to generate trade ideas in this trading method. We use HMA (21) that moves in various directions according to the market forces, and when it slips on the downside declares bearish pressure on the asset price and vice versa. We recommend using this trading strategy in a daily chart to obtain the best results.
Bullish trade scenario
When seeking to open buy positions, check the conditions below:
- The RBCI dynamic line stays above the green zone and slops on the upside.
- The price reaches above the HMA line.
- The HMA line starts sloping on the upside.
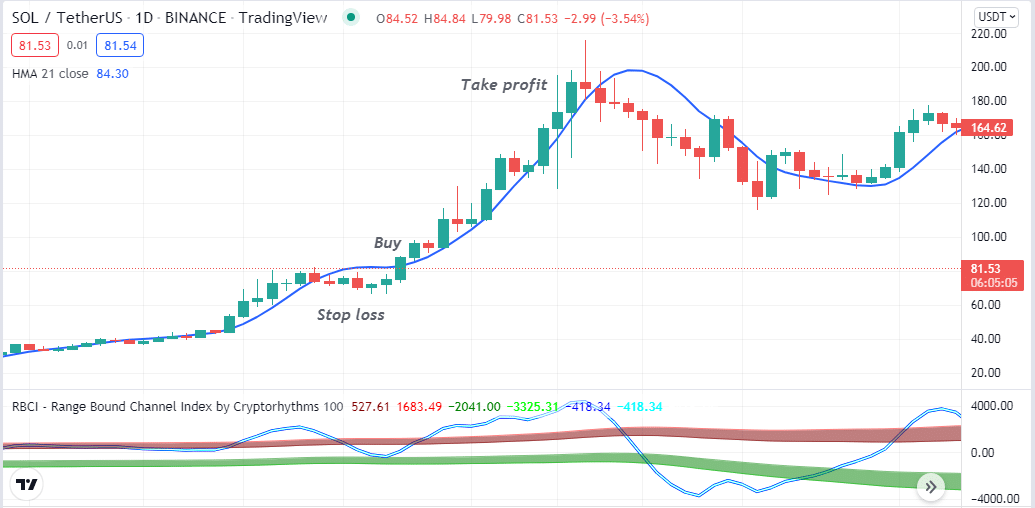
Entry
These conditions above declare the price may enter an uptrend and open a buy position.
Stop loss
Set an initial stop loss below the current bullish momentum.
Take profit
Close the buy position by matching these conditions below:
- The RBCI dynamic line reaches the red zone or above.
- The RBCI dynamic line starts to drop after getting the red zone.
- The price reaches below the HMA line, and the HMA line starts sloping on the downside.
Bearish trade scenario
When seeking to open sell positions, check the conditions below:
- The RBCI dynamic line stays below the red zone and slops on the downside.
- The price reaches below the HMA line.
- The HMA line starts sloping on the downside.
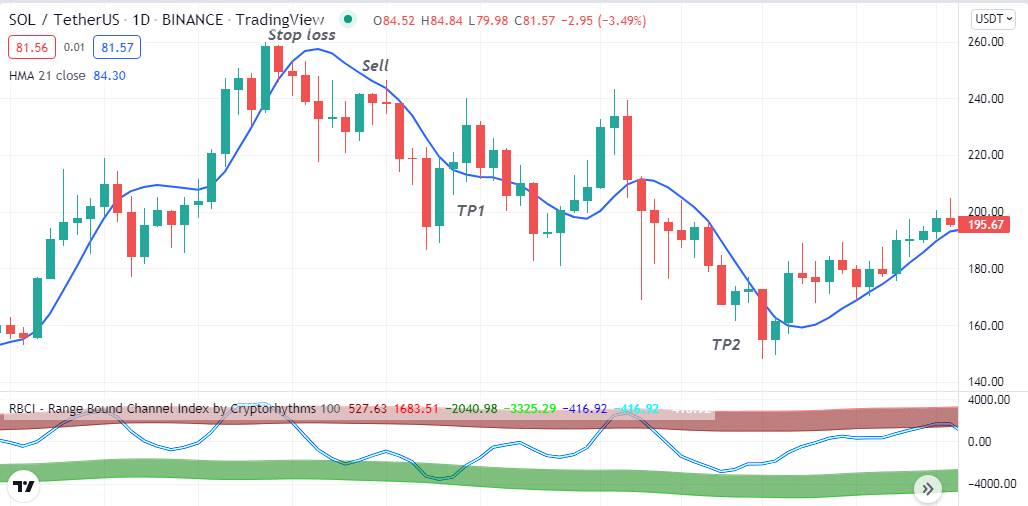
Entry
These conditions above declare the price may enter a downtrend and open a sell position.
Stop loss
Set an initial stop loss above the current bearish momentum.
Take profit
Close the sell position by matching these conditions below:
- The RBCI dynamic line reaches the green zone or below.
- The RBCI dynamic line starts to increase after getting the green zone.
- The price reaches above the HMA line, and the HMA line starts sloping on the upside.
Pros & cons
| Pros | Cons |
|
|
|
|
|
|
Final thought
The RBCI indicator is so helpful in generating constantly profitable trade ideas for crypto investors. Don’t forget to follow proper trade and money management rules while using this tool in live trading.


