
Either you are a beginner or an experienced trader, indexes might be that one asset on your continuous radar. If counted, there are nearly 5000 indexes in US stock, and among them, the S&P 500, DJIA, and the NASDAQ are the ones trading at large.
For those new to trading, it is essential to know that these indexes are closely correlated to each other as their primary purpose is to track companies affected by a similar economic situation and other fundamental factors. All these indexes are different in:
- The industry types
- The overall price calculation process
- The number of listed companies
However, some companies are listed in all three indexes, like Apple Inc. S&P 500 and DJIA suffer from some conflicts by the traders and investors, raising the question of which one is better.
Let’s identify why some traders choose S&P more over DJIA.
Understanding the DJIA
The Dow Jones Industrial Average (DJIA) is the oldest US stock index introduced in the 1800s. When started, this index kept track of the 12 most prominent companies in the US but by today got updated to 30.
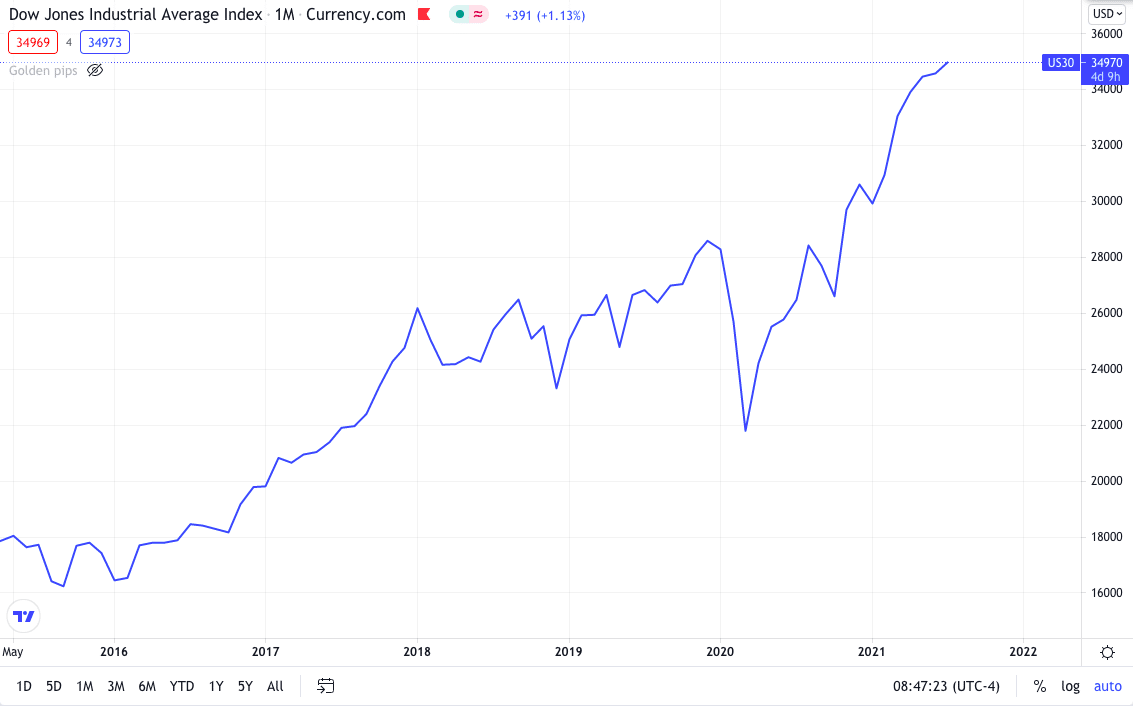
The world “industry” in Dow Jones signifies the top companies in their particular industry. It consists of the top 30 stocks considered blue-chip companies or the most reputed ones in their sector.
Understanding the S&P 500
The Standard & Poor’s 500 Index, also known as the S&P 500, started way long after the DJIA in 1962. It records 500 large-cap stocks, or you can say the 500 biggest publicly traded companies in the US. These 500 entities have their stocks listed on the NASDAQ Composite and New York Stock Exchange.
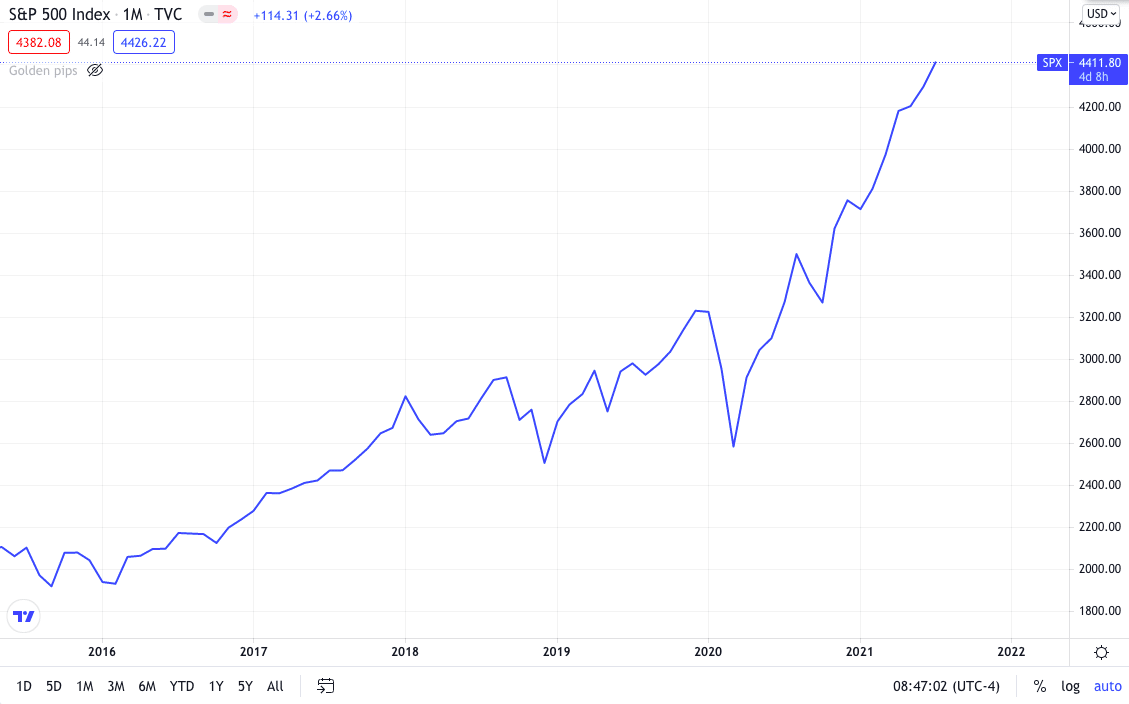
S&P 500 companies stock list is created to describe the overall distribution of the US economy. Therefore, the S&P’s values are sharply tracked by traders and investors as their performance represents a standard of the health of the US economy.
The difference between the S&P 500 and Dow
These two indexes are very similar but yet different. Let’s get closer to understanding it better.

- Market sectors
The sector collection plays the most significant role in the overall performance of any index. The stocks are classified as the sectors they belong to. Apple and Microsoft belong to the technology sector; oil and electricity come under energy while banking is in finance.
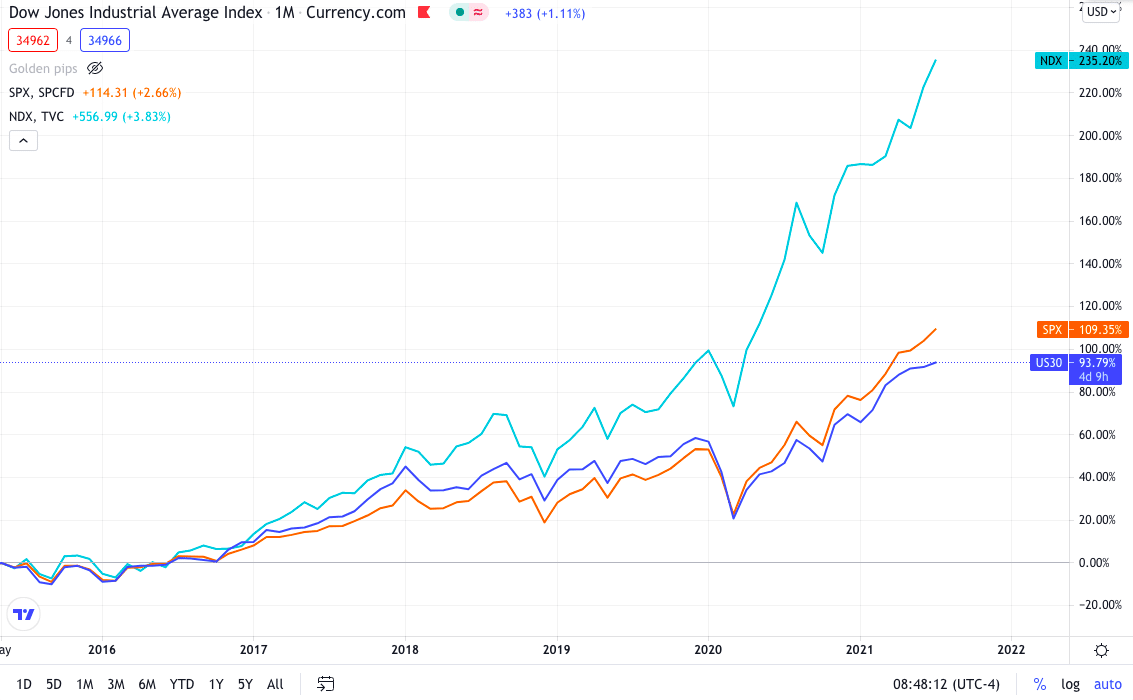
Below are charts that compare the sector weights in these two indexes. The second chart provides a summary of the difference in the sector weightings.
- 30 vs. 500 listings
One of the most notable differences between these two indexes is the number of companies listed in them. The S&P has 500 of the largest traded companies listed in it, with the distribution among 11 sectors, including health, energies, utility, and technology. The other index consists of 30 blue-chip companies distributed over nine sectors.
- Market-weighted vs. price-weighted
After the number of companies listed, the significant differences come in how these particular indices are evaluated. Some of the performance of the stocks listed in them makes a more substantial impact on both indices. The S&P 500 is market-weighted, which means that the companies with the largest market cap have more weightage over the overall index’s price movement.
In comparison, the Dow is price-weighted, meaning the companies’ stocks with the highest price have the most adverse impact on their price movement.
- Volatility differences
If comparing, we can state the S&P 500 is more volatile than the Dow. If a comparison is made between three significant indexes (NASDAQ, S&P 500, DJIA), so the NASDAQ would be the most volatile, followed by another two.
- Performance
S&P 500 and the DJIA indexes perform differently because of the significant variations in the calculations and the number of listings.
Although we can say, the S&P 500 has slightly beaten the DJIA in performance in recent years. But in the overall time frame, the first one gained 117%, while the second has risen more than 145%.
When does the S&P 500 beat the Dow?
Both indexes have a practical approach to price calculation. But typically, the S&P 500 achieves better than the Dow with the overall distributed companies in large sectors. The big companies listing the US stocks in the S&P 500 are another reason why few investors choose it over Dow.
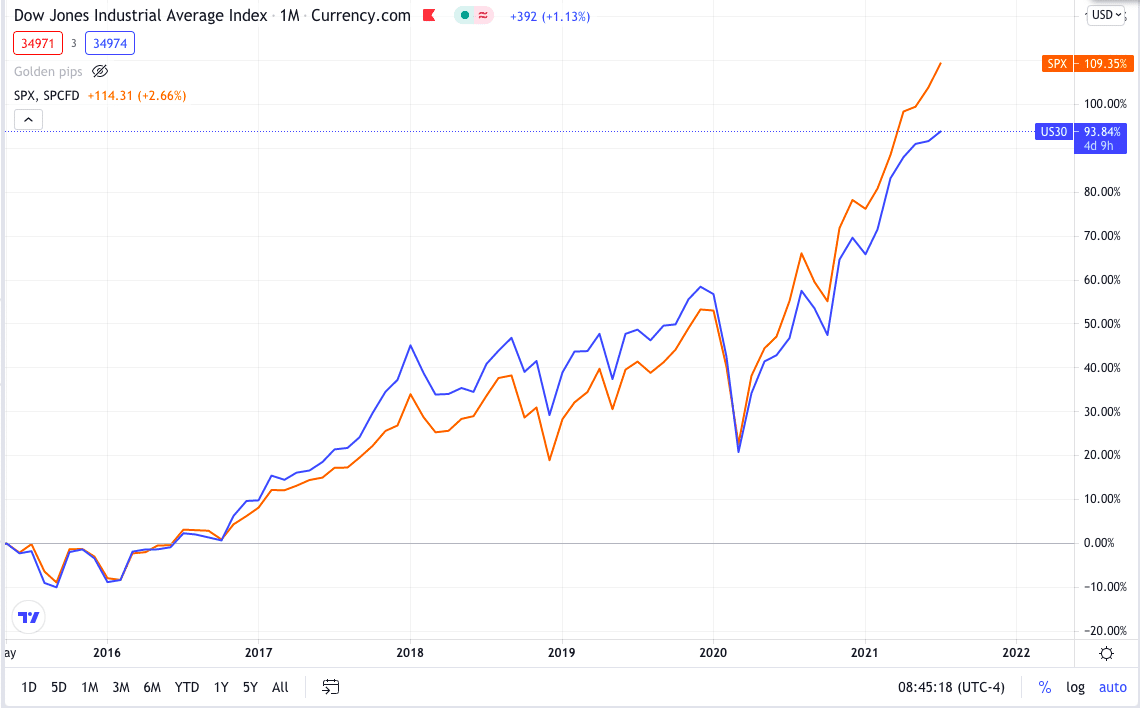
In the above chart comparison, you can see S&P represented by the orange price line showing a significant rise overall of 109.35%, while the Dow represented by the blue price line is 93.84% as of the time of writing this article.
Final thoughts
Notwithstanding the correlation between indexes, they have the character that makes them different for traders and investors. Choosing any of them for investing depends entirely on your style. The S&P 500 has seen many changes in the count starting back from World War II after the economic boom, raising the list from 500 to 700. Eventually, the value decreased from 700 to 300 in 1969 to early 1981.
While you might have seen news covering more of the Dow and less of the S&P 500, this is because the DJIA has a more significant price movement as compared to the S&P 500, grabbing more attention.
Assuming both indexes drop 2% in a single day, this will correspond to a 554 point drop in the DJIA and a 67 point drop in the S&P 500 Index.


