
Developing a trading strategy begins with a simple idea. This idea often comes from awareness of common market phenomena that seem to occur with great regularity. One of these phenomena is the mean reversion market anomaly.
This article will give a cent on the mean reversion theory, how often the anomaly appears and whether strategies built around it work or not. You will learn various tools to determine if a mean reversion opportunity exists that you can profit from as a trader.
What is mean reversion?
Mean reversion is a statistical concept that assumes asset values return to the mean or average after diverging from it significantly. The exact time of reversion is not always easy to predict, but it will come to pass in time. Traders use the mean reversion principle to analyze price movement and market conditions and create a trading strategy.
The mean reversion concept is related to a famous trading idea that what comes up must come down. Therefore, traders utilizing this concept attempt to identify scenarios wherein price movement is beyond normal or where volatility is too high. Then traders mark time to get in when the market shows clear signs of reversing back to the mean.
The mean or average price is a relative concept and depends on what the trader considers as such, but you can use tools to identify the mean value more objectively.
Five tools to predict price reversion
You can use several tools to understand if a market is ready to revert after an impulsive move in one direction. These tools include technical indicators commonly used by traders and even price action.
In addition, you will learn five familiar tools that you might have otherwise used in your trading. Applying the mean reversion theory to your trading might benefit you greatly as it allows you to get in and out of trades quickly.
Tool №1: Moving average
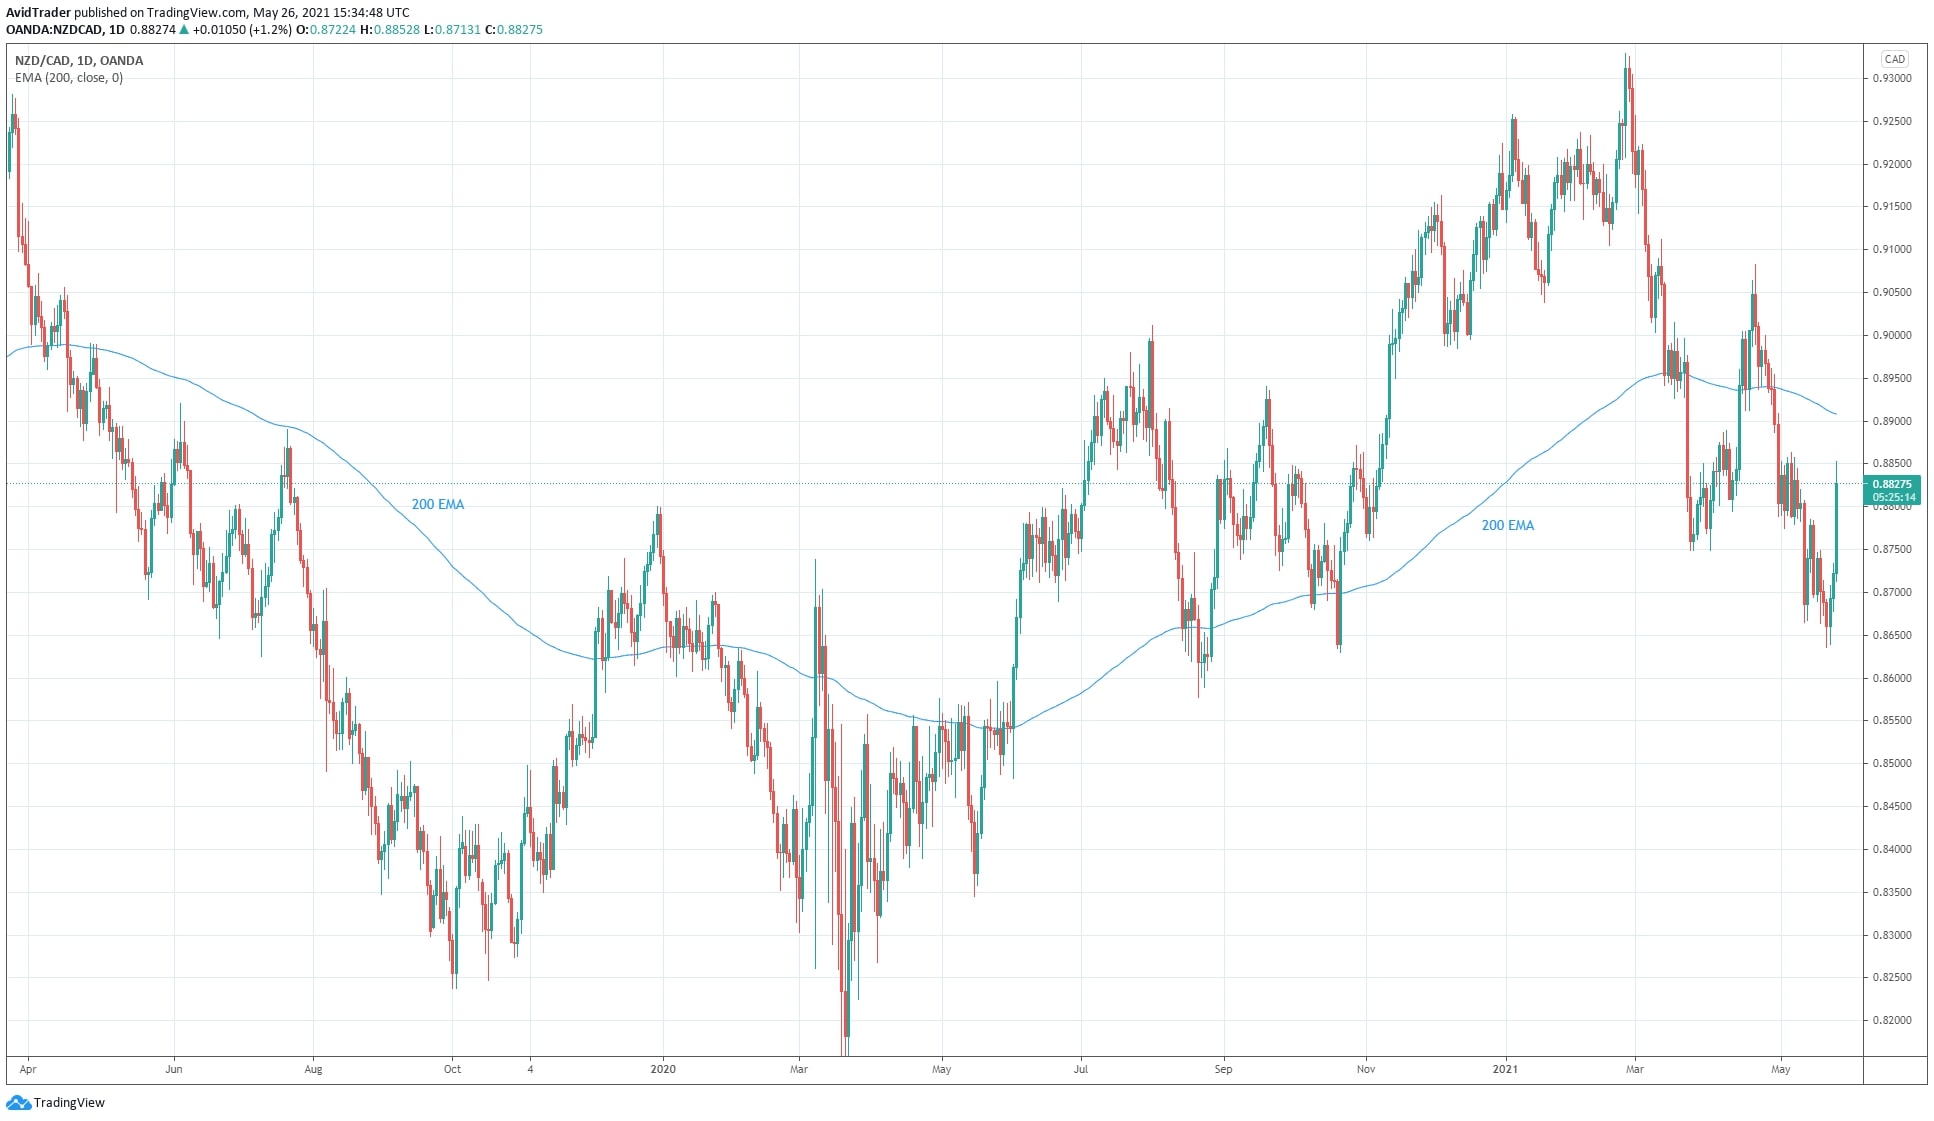
Probably the best tool in the trade that illustrates the concept of mean reversion is the moving average. The type of MA, such as exponential, simple, smoothed, linear weighted, etc., does not matter much for this purpose. You can use any MA. Each type tells the same thing. Meanwhile, you can plot any moving average period on your chart, but the best MA is generally one with a long-term period, such as 100 and 200.
You can see the daily chart of NZD/CAD with the 200 EMA superimposed in the above image. The price plays around its average. After deviating far enough from the 200 EMA, the price snaps back and at least touches the line soon after.
For example, if the price went up violently and has moved too far from the 200 EMA, you can expect the price to return to it at some point. Then you can look for an entry to capitalize on the eventual price reversal. You can think of the moving average as a magnet that repels and attracts price alternately.
This market pattern occurs over and over again, and you might find ways to profit from it.
Tool №2: Relative strength index
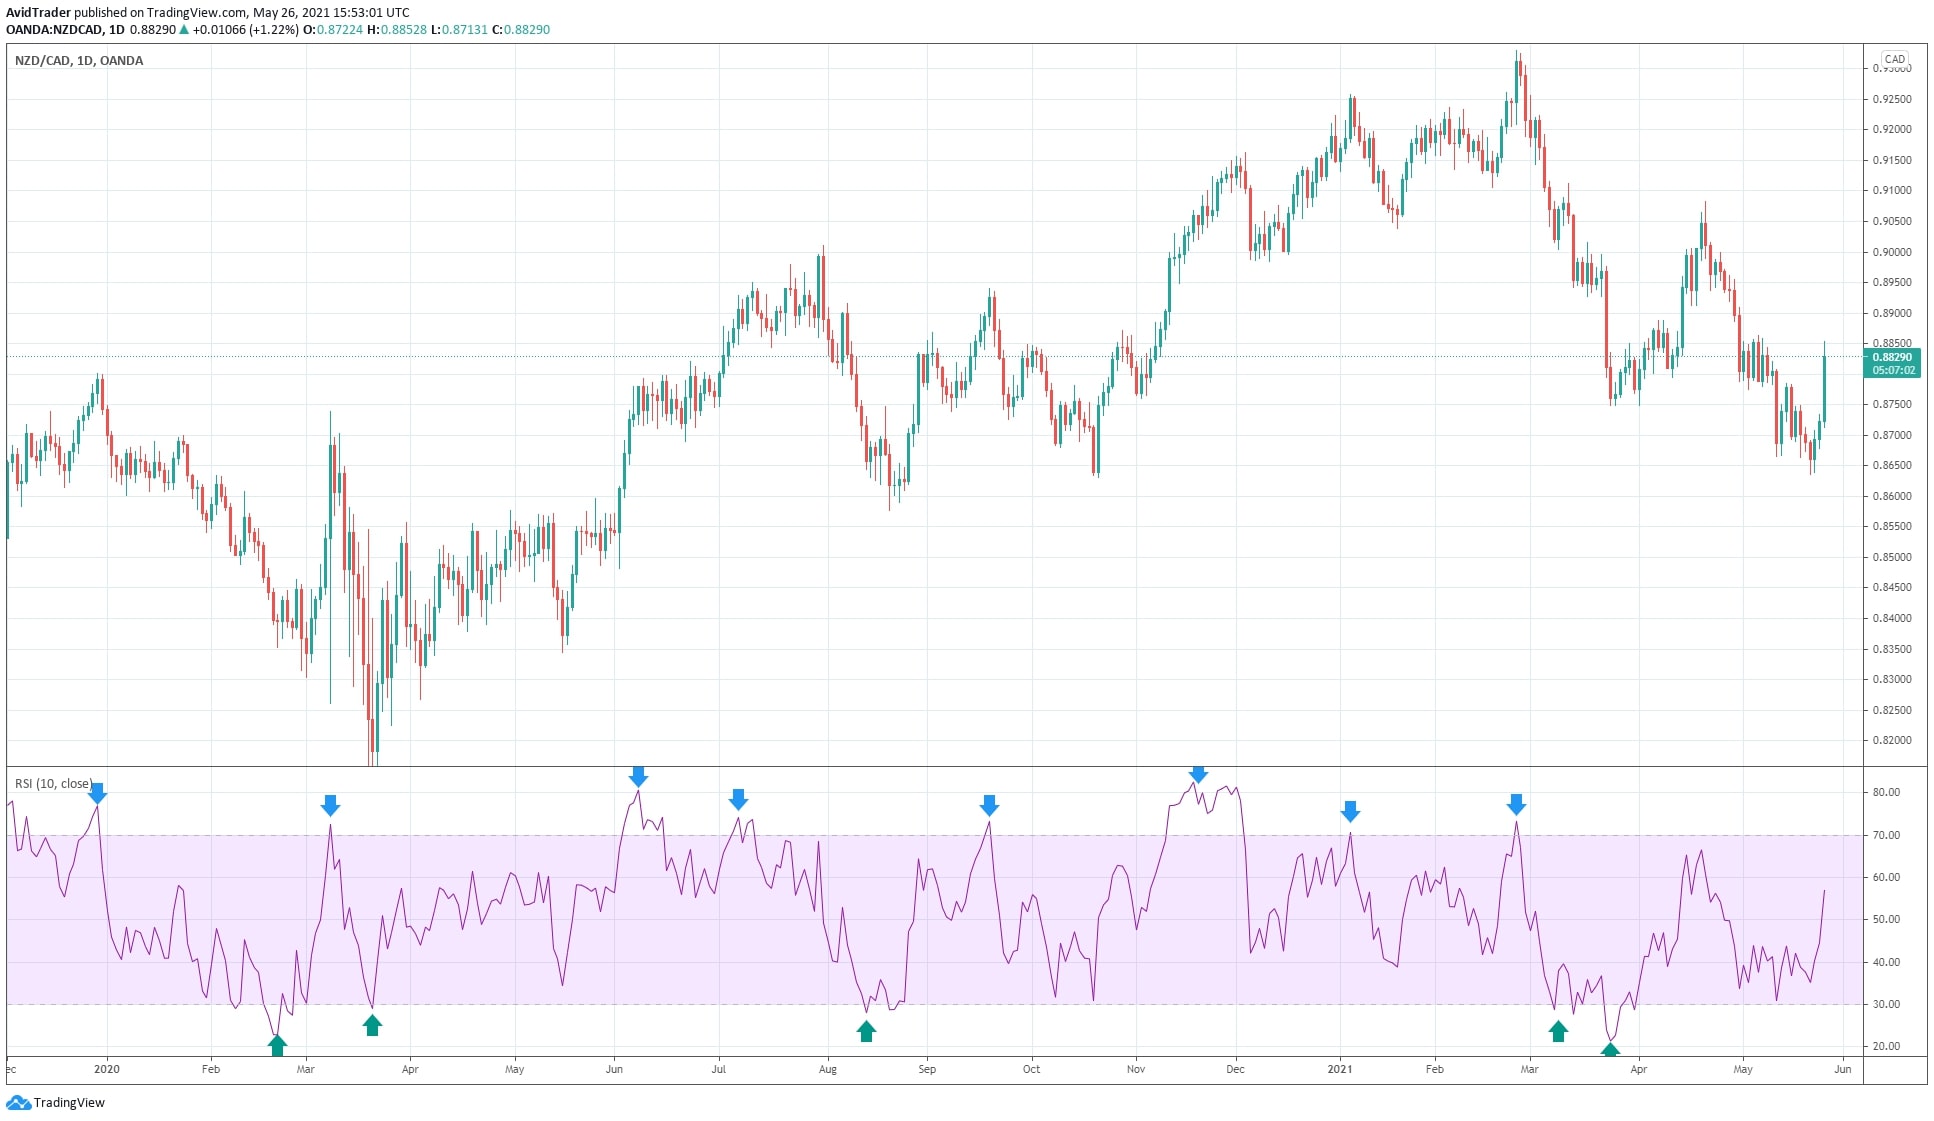
One use of RSI is to gauge market strength, which you can understand by looking at the slope of the RSI line. Another common way to use RSI in trading is getting overbought and oversold signals. These signals are the RSI interpretation of mean reversion.
When the RSI is in overbought/oversold territory, traders expect a reversal or correction in price as the asset becomes overvalued or undervalued. This attracts attention from market players to put the asset in focus and take trades against the current trend. The result is that price returns to its normal range, which is often near the 50 level.
In the above chart, you can see the daily chart of NZD/CAD with nothing but price and RSI below it. In the RSI window are up and down arrows highlighting the points where RSI went overbought or oversold. Although the price did not immediately reverse after reaching the extreme conditions, it eventually did reverse or correct. This does not mean that RSI has failed. As a momentum indicator, RSI moves ahead of price. Traders understand that momentum shift precedes price movement.
Tool №3: Bollinger bands
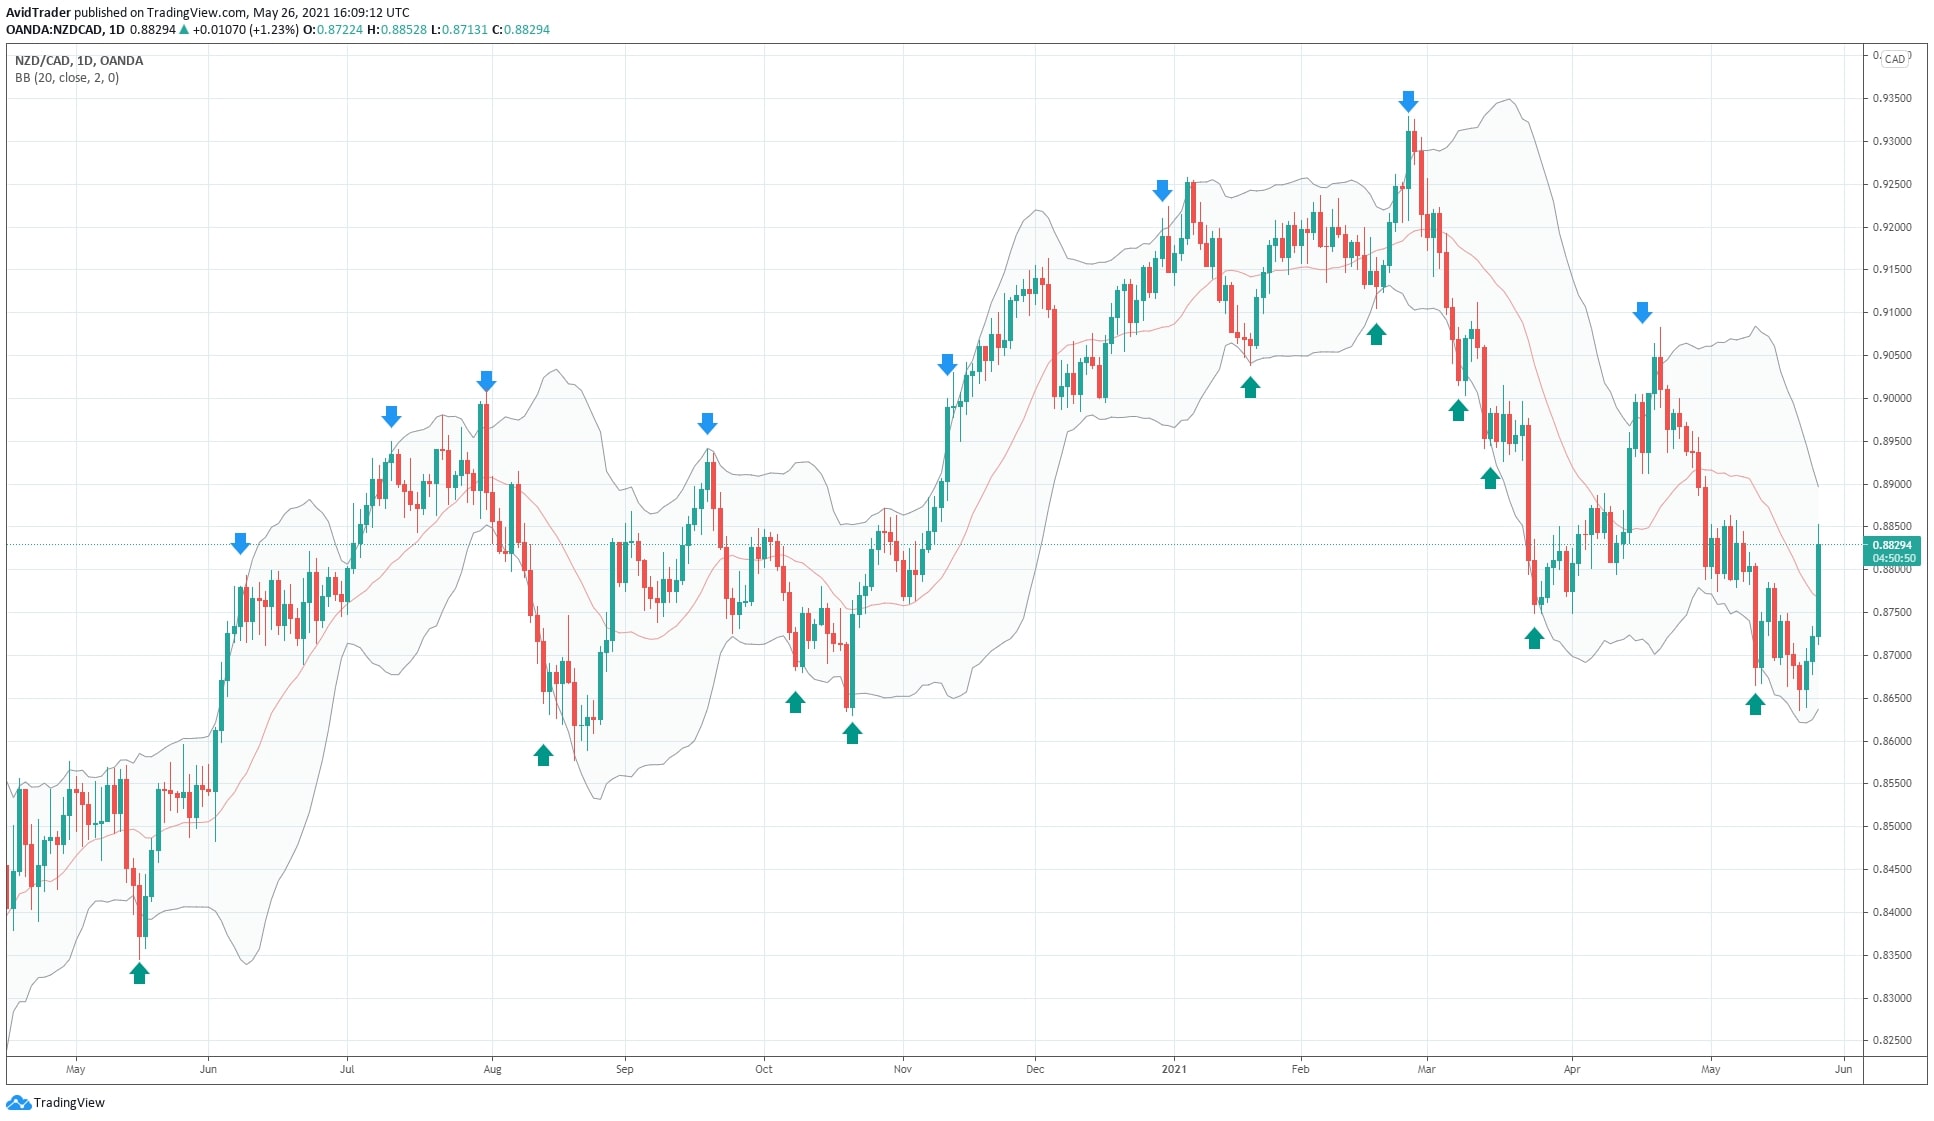
The above chart shows the NZD/CAD daily chart with the BB indicator. In its inception, BB was not designed to trade breakouts after a consolidation. Instead, the original purpose was to tell whether the price is overvalued or undervalued, which occurs when the price touches the upper or lower band.
- If the price touches the upper band, the market is considered overvalued and has a bearish outlook.
- If it touches the lower band, the market is deemed undervalued and has a bullish prospect.
In the above image, the up arrows mark the instances where price touches the lower band, and the down arrows mark the times when price touches the upper band. Although the price did not always reverse after touching the outer bands, you can see a reaction when such an event happens.
At some point, the price changed or made a pullback. Price is in the regular or average range when it is located within the band.
Tool №4: MACD
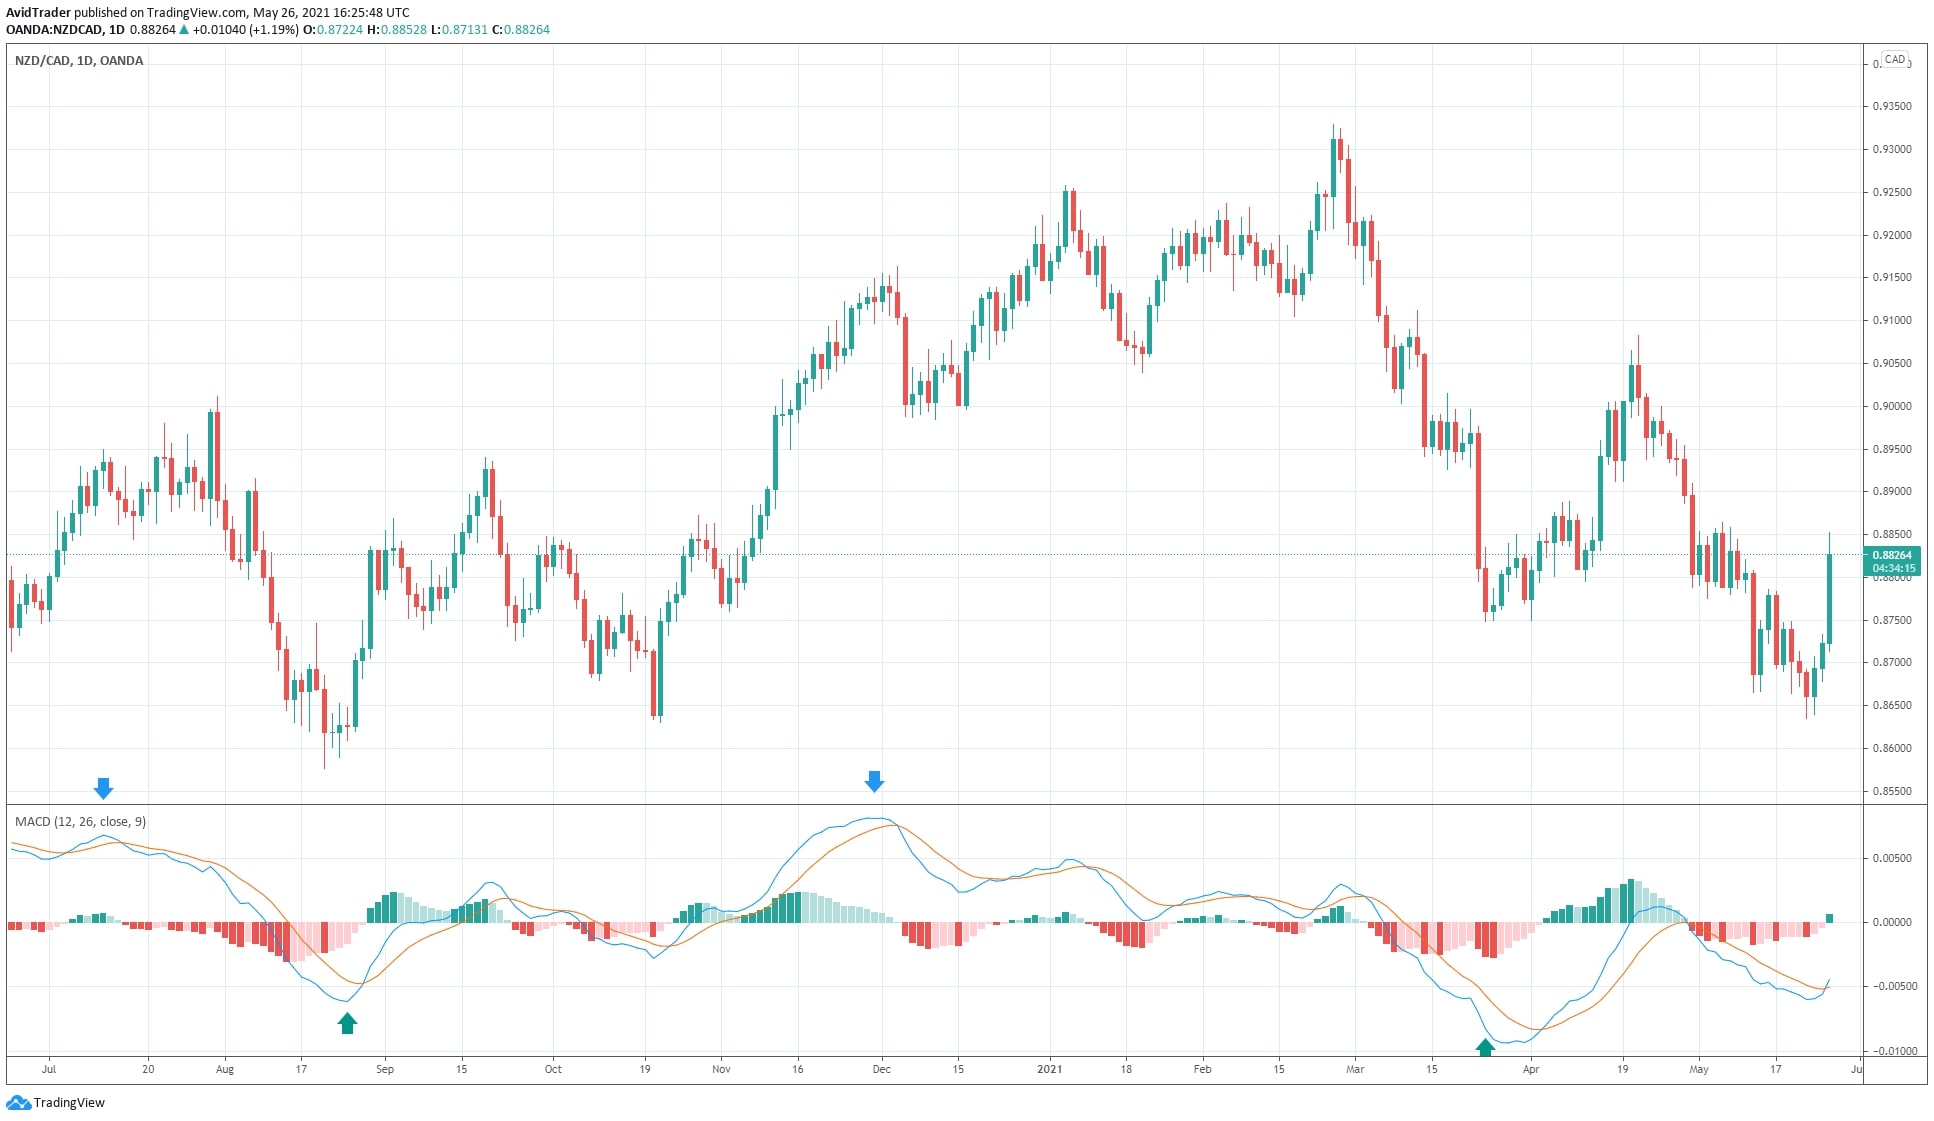
The MACD indicator can also tell if the price has strayed significantly far from its mean and when it is about to revert. Although MACD has no defined upper and lower boundaries as other oscillators have. So it just moves above and below the zero line, and this behavior repeats time and again.
While not familiar to many, the MACD is good at picking tops and bottoms when the price has made an extended move in one direction. You can see these tops and bottoms as up and down arrows in the MACD window.
When the MACD line is too far above or below the zero line, the underlying asset becomes overbought/oversold and could reverse anytime soon. This reversion often occurs after the mainline and signal line has crossed. It is true in four instances shown in the above chart.
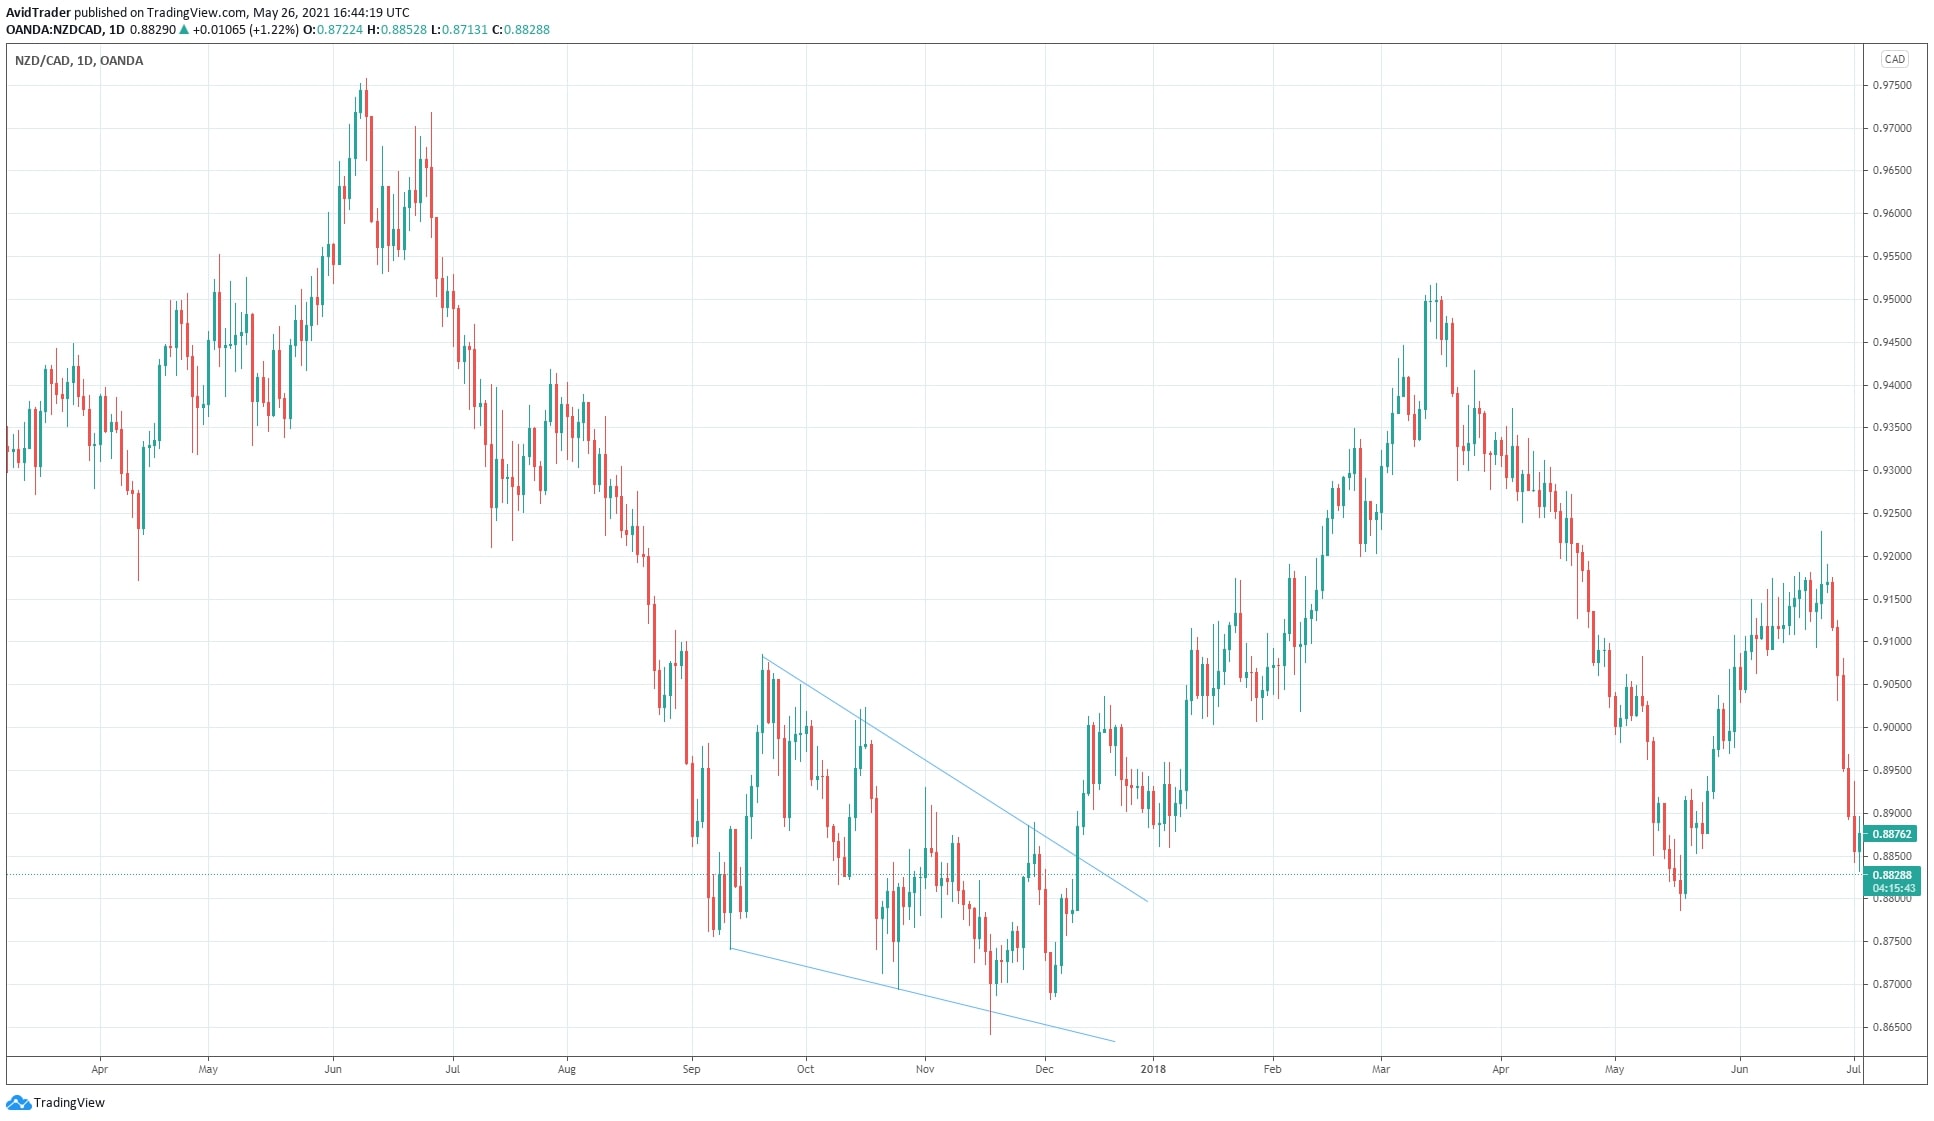
Tool №5: Chart patterns
The above visual shows the NZD/CAD daily chart with the naked price and two trend lines. Reversals happen when prices trend in one direction for a while, and chart patterns such as 1-2-3 patterns, triangles, and wedges often mark the reversals.
Price typically forms such chart patterns at the end of a sustained price movement. The most effective pattern among these is arguably the wedge.
It requires a lot of time and bars to build, getting attention from many traders and prompting them to close the current positions and open new positions in the opposite direction.
As shown above, where the wedge pattern formed, the price was able to make new lows, but the swings lacked the strength to continue downward. The breakout of the upper trend line marked the change in direction. You need only two points to draw the trend line. Price touched the lower trend line three times but failed to do so on the fourth attempt. The higher low after the third push down signals a possible bullish reversal, which the eventual breakout then confirms.
Final thoughts
Mean reversion is a simple concept that you can apply to trade the financial markets. Strategies built around this concept can be effective as mean reversion is a typical market phenomenon. How you make use of this concept will make all the difference.
This article has presented the tools you can use to trade with mean reversion in mind. First, find one or two that make the most sense to you. Then, combine it with other tools to develop a profitable trading system.