
The vortex indicator is a marvelous technical tool that determines accurate entry/exit positions of trades. Crypto investors often seek technical indicators that help them assess trend switching points and trends, using this info effectively while making trade decisions. The vortex indicator is one of the best capable of delivering all this info.
However, it is impossible to use any indicator effectively without learning the concept and knowing the components. This article dives deep into the VI. Moreover, we describe trading strategies using this indicator with chart attachments to understand better.
What is the vortex indicator?
It is a unique technical indicator that works with different parameters of price candles like high, low, previous close, etc. Douglas Siepman and Etienne Botes are the developers of this indicator and the first introducing period is 2009. They revealed this concept in an edition of “Technical Analysis of Stocks & Commodities.”
This indicator shows readings in an independent window that contains two trend lines, VI+ and VI-. The VI+ line is blue, and the VI- line is red.
How to trade using the vortex indicator?
The VI involves no complications. The dynamic two lines of different colors represent two different price movement forces. When any crossover occurs between these two lines, it declares the beginning of a new trend. The blue line reaches above the red line indicating sufficient bullish force on the asset price and vice versa. Frequent crossovers between these lines show the price remains sideways.
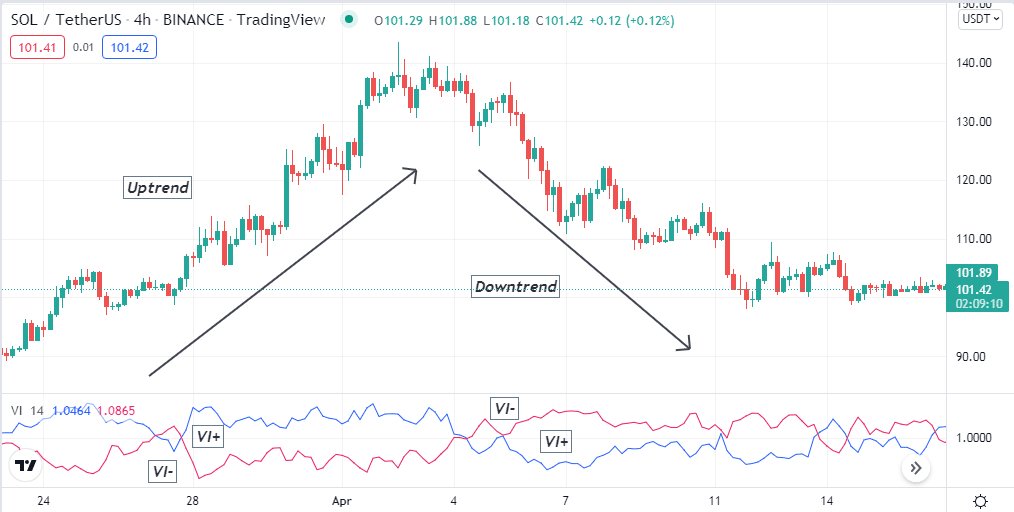
Meanwhile, the distance increases between these lines as the momentum gains strength. You can use this concept independently while making trade decisions. Otherwise, use many other technical indicators and tools to generate more efficient trading ideas.
Short-term trading strategy
This trading method uses three technical indicators: Parabolic SAR, Vortex indicator, and the ADX. The parabolic SAR and Vortex indicator identifies the current trend and trend switching points and shows them differently.
Meanwhile, the ADX indicator confirms the strength of the current trend. So any crypto investor capable of combining all these readings can participate in constantly profitable trades. The recommendable timeframes for this short-term trading method are 15min and H1.
Bullish trade scenario
Set all three indicators in your target asset chart and observe the readings. Check the conditions below:
- The blue dynamic trendline of the VI window surpasses the dynamic red line on the upside.
- Parabolic SAR dot takes place below price candles.
- The ADX indicator reading is over 20 and increasing.
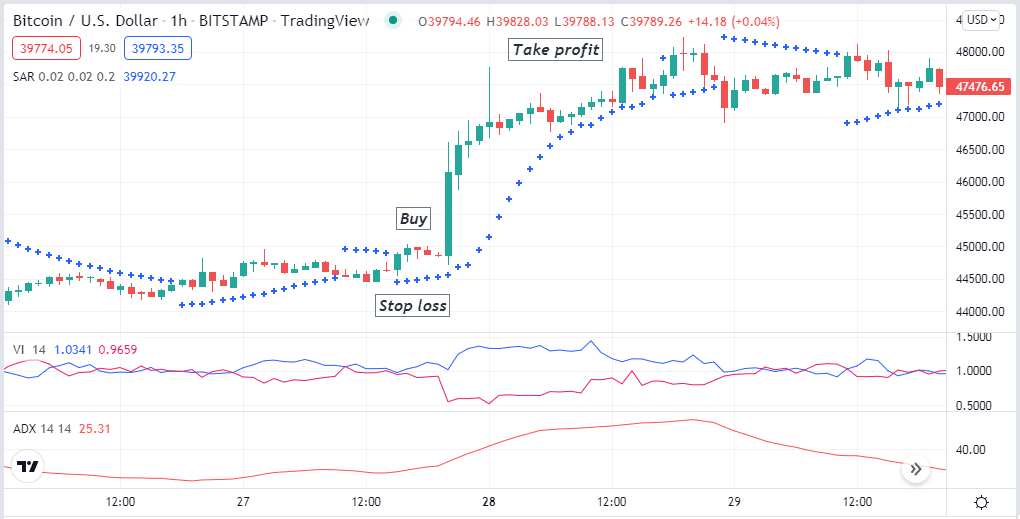
Entry
These conditions above declare a potential bullish pressure on the asset price. Match these conditions and open a buy position.
Stop loss
Set an initial stop loss below the current swing low with a buffer of 10-15pips.
Take profit
You can continue your buy order till the price remains on the uptrend. Close the buy order by matching the readings below:
- The dynamic blue trendline drops below the dynamic red trendline in the VI window.
- Parabolic SAR dots switch on the upside of price candles.
- ADX value drops below 20, declaring the uptrend losing strengths.
Bearish trade scenario
Set all three indicators in your target asset chart and observe the readings. Check the conditions below:
- The blue dynamic trendline of the VI window surpasses the dynamic red line on the downside.
- Parabolic SAR dot takes place above price candles.
- The ADX indicator reading is over 20 and increasing.
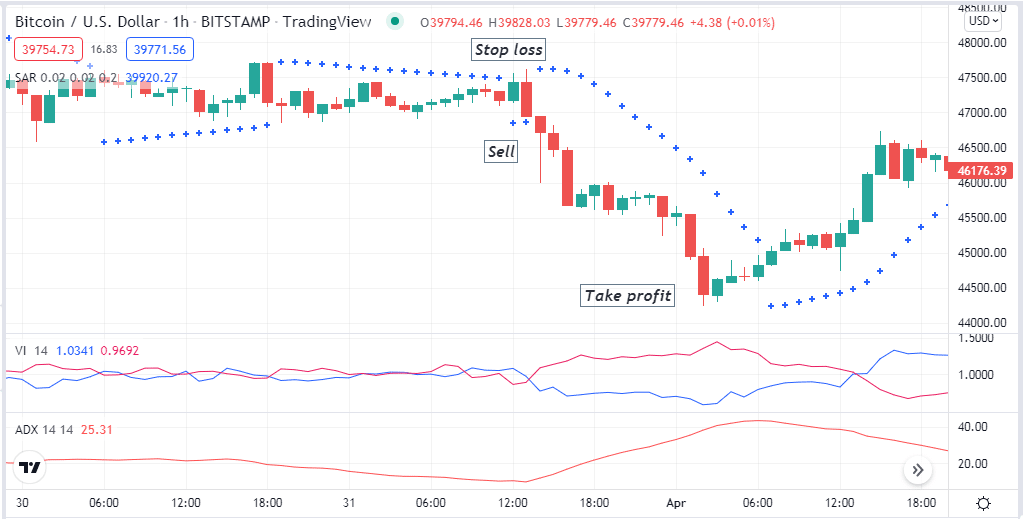
Entry
These conditions above declare a potential bearish pressure on the asset price. Match these conditions and open a sell position.
Stop loss
Set an initial stop loss above the current swing high with a buffer of 10-15pips.
Take profit
You can continue your sell order till the price remains on the downtrend. Close the sell order by matching the readings below:
- The dynamic blue trendline reaches above the dynamic red trendline in the VI window.
- Parabolic SAR dots switch on the downside of price candles.
- ADX value drops below 20, declaring the downtrend losing strengths.
Long-term trading strategy
The BB indicator is among the most popular technical tools in the financial market. This trading method combines the Bollinger Bands indicator with the VI to generate trade ideas. We recommend using an H4 or D1 chart to get efficient trade setups.
Bullish trade scenario
Set both indicators and observe the readings when seeking buy positions, such as:
- The dynamic blue trendline getting above the dynamic red trendline on the VI window.
- The price goes above the middle band of BB and remains on the upper channel.
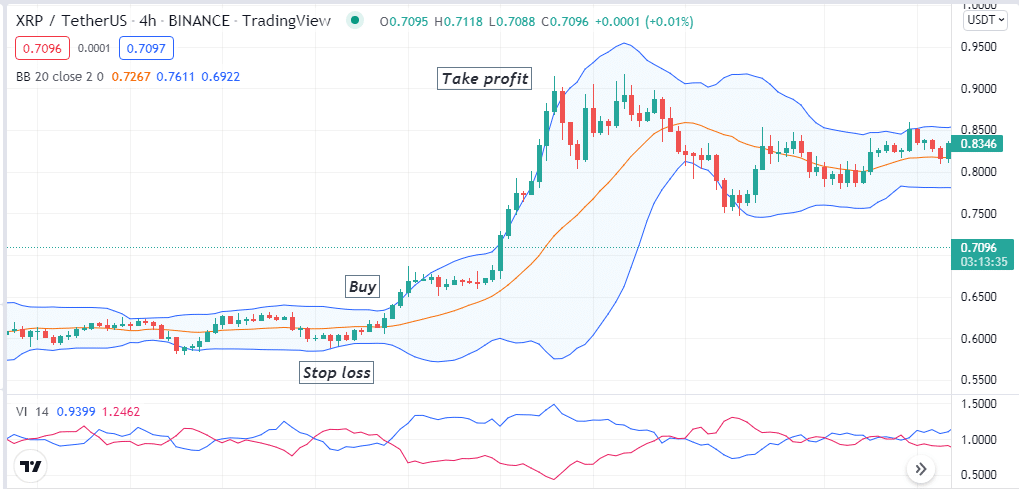
Entry
Match these conditions above with your target asset chart; it suggests a potential buy setup. Open a buy position.
Stop loss
The initial stop loss will be below the current bullish momentum.
Take profit
You can continue your buy order till the price remains on the uptrend. Close the buy order by checking the conditions below:
- The dynamic blue line declines below the dynamic red trendline on the VI window.
- The price reaches below the middle band of the BB indicator.
Bearish trade scenario
Set both indicators and observe the readings when seeking sell positions, such as:
- The dynamic blue trendline getting below the dynamic red trendline on the VI window.
- The price goes below the middle band of BB and remains on the lower channel.
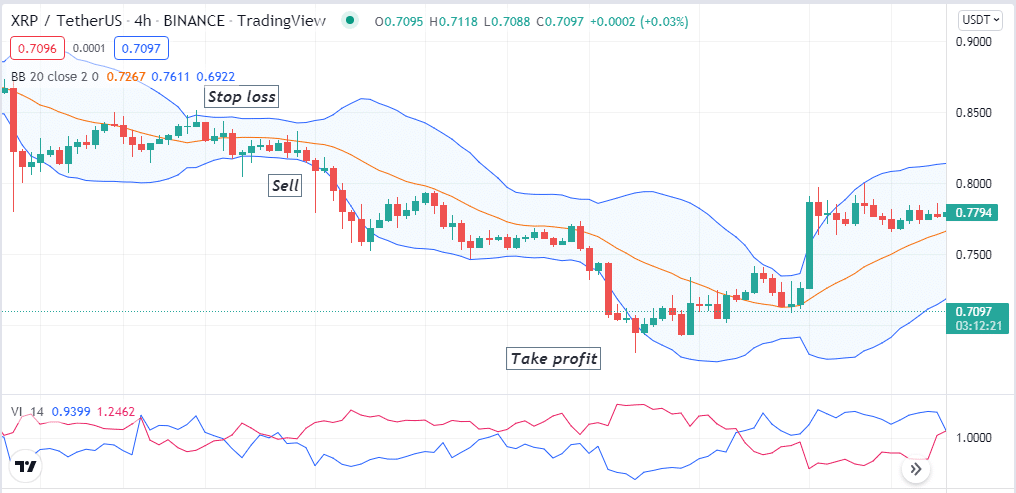
Match these conditions above with your target asset chart; it suggests a potential sell setup. Open a sell position.
Stop loss
The initial stop loss will be above the current bearish momentum.
Take profit
You can continue your sell order till the price remains on the downtrend. Close the sell order by checking the conditions below:
- The dynamic blue line reaches above the dynamic red trendline on the VI window.
- The price reaches above the middle band of the BB indicator.
Pros & cons
| Pros | Cons |
|
|
|
|
|
|
Final thought
Finally, you know all the primary factors and successful implementation procedures for the vortex indicator. Now master the concept with good practice; don’t forget to follow adequate trade and money management rules when trading cryptocurrencies using the VI.


