
Candle formations or candlestick patterns are like footprints of the price movement to traders who can read them. Candlestick patterns reflect the market context as well as participants’ sentiments on particular assets. Identifying those patterns enables traders to make precious trading positions.
However, it requires some skills to identify those patterns and combine the market context with them to determine entry/exit positions of any executing trade. This article contains a brief discussion on the M and W patterns besides explaining trading strategies using those patterns with chart attachments.
What are the W-bottom and M-top patterns?
The pattern looks like the letter ‘W,’ which is similar to the double bottom pattern. This pattern is fully potent when it occurs near any support level where a downward ends formation and price starts to bounce upwards. It signals a potential upcoming uptrend price movement as bullish pressure triggers when the price movement creates a support level twice and does not break below.
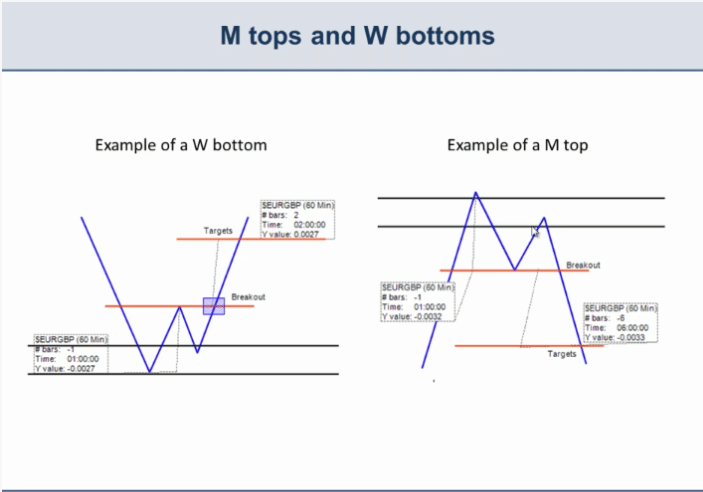
On the other hand, the M pattern shares similarities with the double bottom pattern that looks like an English alphabet M. This pattern creates a resistance level by reaching twice on a certain level and not breaking above.
In both cases, the support and resistance can be slope lines rather than straight horizontal lines.
How to trade using the W and M patterns
You can execute your trades using those patterns by following some steps below.
Step one
In the first step, identify the patterns in places where they are most potent — mark the W-bottom near the finish line of any downtrend. Meanwhile, seek the M-bottom pattern near the ending of an uptrend.
Step two
Combine the market context with other technical indicators to determine the most accurate potential entry/exit positions with low risks. You can use technical indicators or tools, such as the Fibonacci retracements, MACD, RSI, MA crossovers, support resistance, etc.
Step three
Execute trades according to your trading methods. For the M-top pattern, place a sell order when the price breaks below the previous low after making the second top. Similarly, when price breaks above the last high on the W-bottom pattern after creating the second low, place a buy order.
Step four
In the last step, exit from your open positions according to your trading strategy. Never continue your trade or exit from open positions as soon as possible if the price returns near the support level in W-bottoms or near the resistance level in M-tops for more than twice.
If the price repeatedly returns on those levels, these patterns may signal a continuation of the current trend rather than a reversal.
A short-term trading strategy
In our short-term trading strategy, we use support resistance besides those patterns. This trading method involves using multiple time frame charts. Executing trades using this trading technique will be on the 15-min chart. Meanwhile, we draw support resistance and vital levels from upper time frame charts such as historical levels, weekly/monthly open, low, high, closing, etc.
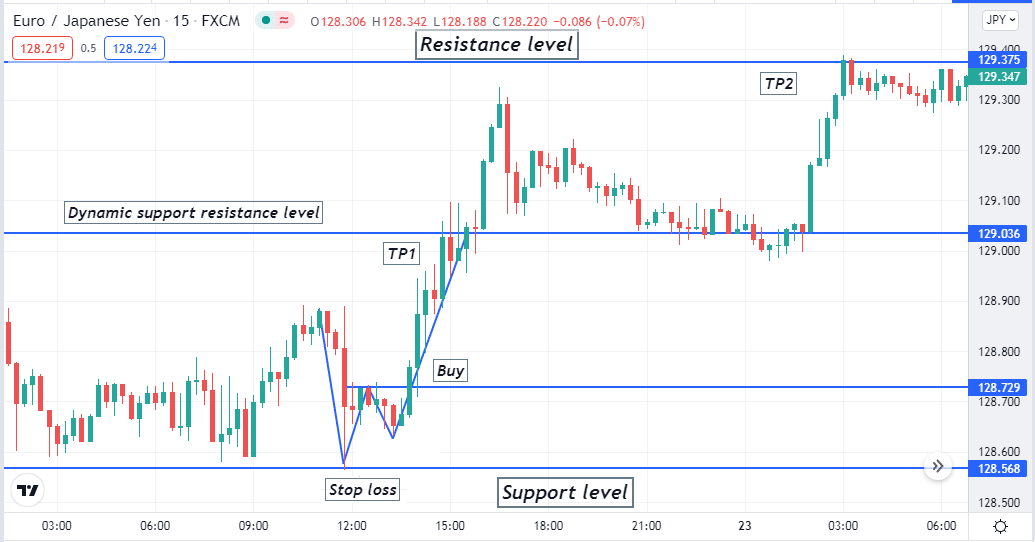
Bullish trade scenario
Identify the W-bottom pattern near any support level and wait for the formation of the second bottom.
Entry
When the price crosses the last high on the upside after making the second low, this pattern declares potential upcoming bullish pressure on the asset price. Place a buy order here.
Stop loss
The initial stop loss level will be below the support level of the pattern formation. You may manually close the buy order if the price comes back again below the second low.
Take profit
The initial profit target will be below the nearest resistance level. You can continue the buy order if the price breaks the resistance on the upside.
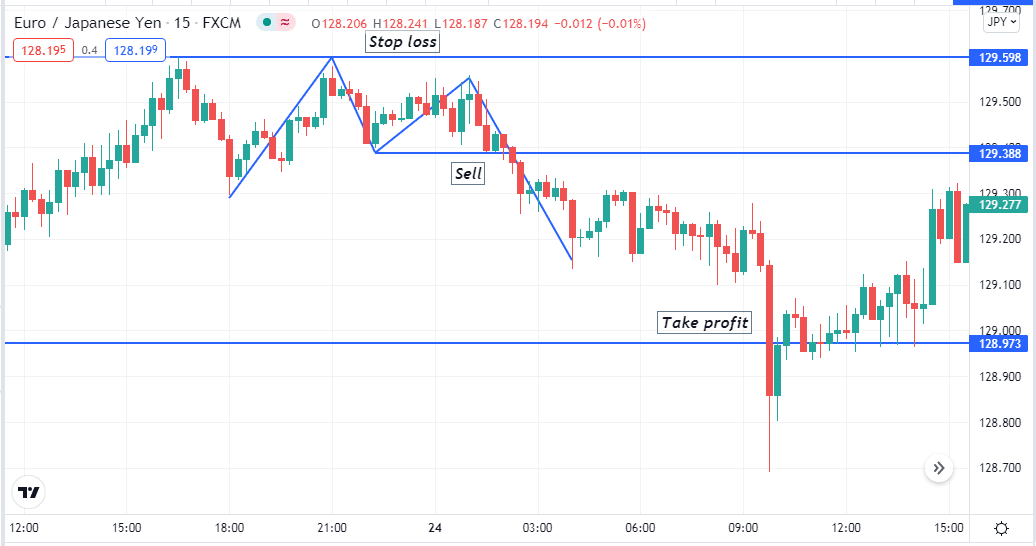
Bearish trade scenario
Identify the M-top pattern near any resistance level and wait for the formation of the second top.
Entry
When the price crosses the last low on the downside after making the second high, this pattern declares potential upcoming bearish pressure on the asset price. Place a sell order here.
Stop loss
The initial stop loss level will be above the resistance level of the pattern formation. You may manually close the sell order if the price comes back again above the second high.
Take profit
The initial profit target will be above the nearest support level. You can continue the sell order if the price breaks the support on the downside.
A long-term trading strategy
Our long-term trading method involves using the two most popular technical indicators, the RSI and the parabolic SAR, besides those patterns. This strategy suits any time frame; we recommend using H4 or above time frame charts to get satisfactory results for catching potential long-term trading positions.
Bullish trade scenario
Mark the W-bottom pattern near the finish line of a downtrend. Then observe the technical indicators, when:
- The second low of the pattern takes place.
- Parabolic SAR dot takes place below price candles.
- The dynamic signal line of the RSI window is near or above the central (50) line, heading toward the upper (80) line.
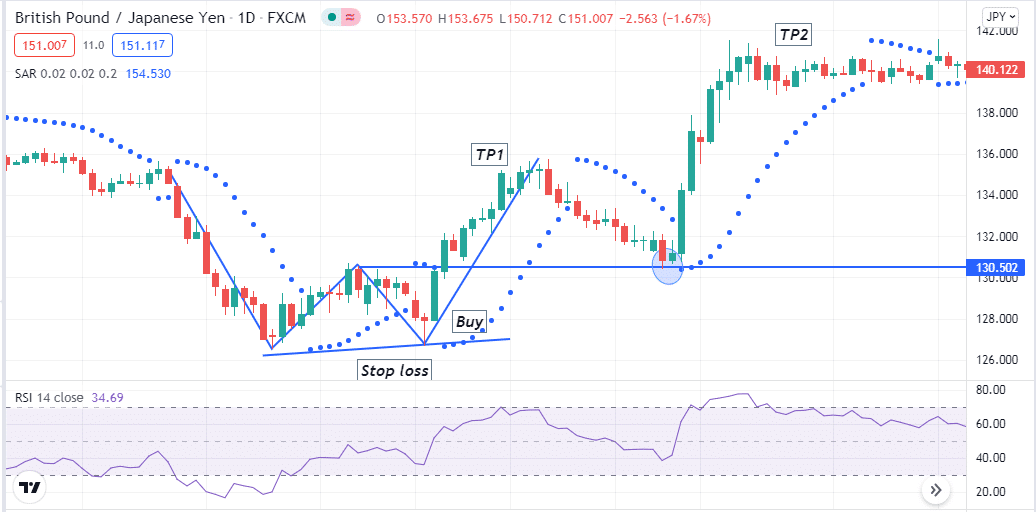
Entry
When these conditions above match with your target asset chart, place a buy order.
Stop loss
Place an initial stop loss below the support level of both lows of the pattern.
Take profit
The initial profit target will be 2X above the breakeven point than the distance between the breakeven and stop loss level. You can continue the buy order till the price remains above the first high after making the first low of the pattern. Sometimes prices retrace back to that dynamic level before reaching more upside. Otherwise, close the buy order when:
- The dynamic signal line of the RSI window heads back toward the central (50) line after reaching the upper (80) line.
- Parabolic SAR dot takes place above price candles.
Bearish trade scenario
Mark the M-top pattern near the finish line of an uptrend. Then observe the technical indicators, when:
- The second high of the pattern takes place.
- Parabolic SAR dot takes place above price candles.
- The dynamic signal line of the RSI window is near or below the central (50) line, heading toward the lower (20) line.
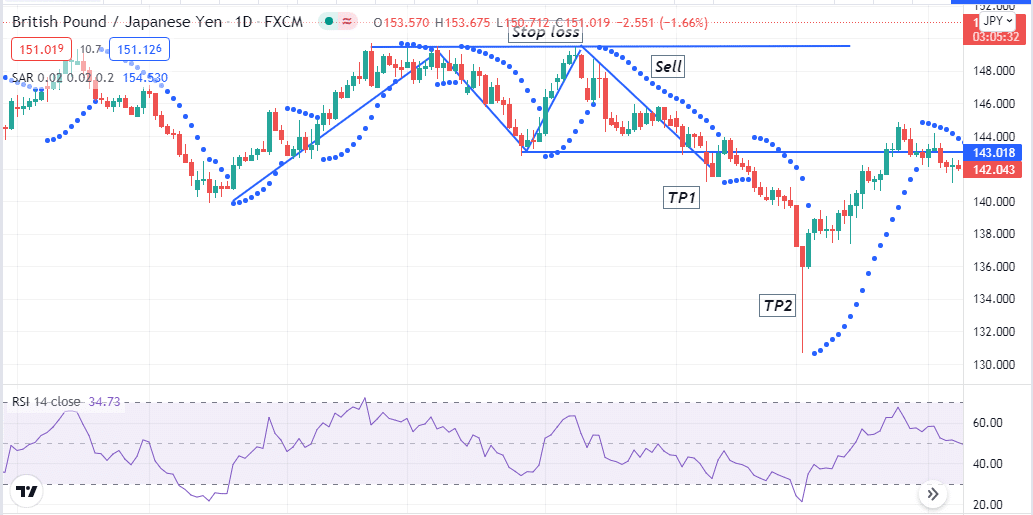
Entry
When these conditions above match with your target asset chart, place a sell order.
Stop loss
Place an initial stop loss above the resistance level of both highs of the pattern.
Take profit
The initial profit target will be 2X below the breakeven point than the distance between the breakeven and stop loss level. You can continue the sell order till the price remains below the first low after making the first high of the pattern.
Sometimes prices retrace back to that dynamic level before reaching more downside. Otherwise, close the sell order when:
- The dynamic signal line of the RSI window heads back toward the central (50) line after reaching the lower (20) line.
- Parabolic SAR dot takes place below price candles.
Pros and cons
| Pros | Cons |
| You can find these patterns frequently. | Requires particular skills to combine these patterns with other technical market contexts. |
| You can trade many trading assets using those patterns. | Requires using other technical indicators/tools to determine complete trade setups. |
| These patterns allow making both short-term and long-term trading positions. | These patterns can fail due to fundamental news releases. |
Final thought
Finally, this article discusses the M-top and W-bottom patterns quite briefly. We hope that you get sufficient info about these patterns in this article. We recommend using these patterns and trading techniques on demo trading for a certain period until you master entire concepts besides learning the potentiality and limitations.