
For all those new to the finance world, FX stands for foreign exchange — the market where currencies are bought and sold simultaneously.
FX does not have currency pairs as a trading asset, but you can also trade in commodities, indices, and crypto. Trading in FX or any other financial market will also need you to have a good strategy that you can follow to make a profit from the market.
There are tons of trading strategies in the market, but we don’t know which strategy works and which does not. Moreover, to use it, you need to buy it from the traders who have created it or sometimes the one that is available for free. Whatever the case may be, deciding on if the particular strategy works is a big task.
But this article here will not make much of your time but help you learn the strategy that not many traders are aware of, but those who do make a lot of profit as this particular FX trading strategy works more than 90% of the time.
What are price action patterns?
Price action is a form of trading that does not include using any indicator on the trading chart; instead, the trading is done by looking at the overall price movement and price pattern formation.
Using price action, you will be ahead of other traders using indicators as most of these tools are lagging and give late entry. Price action will keep you away from noises in the market and help you follow the right market trend and price movement.
What is missed double top & bottom pattern?
Missed double top and bottom is similar to double top and double bottom pattern but with a slight difference in the second price touching the support or resistance. Both the double top & bottom and missed double top & bottom are reversal patterns.
- In the double top & double bottom pattern, the price touches the support or resistance twice, failing to break this zone.
- In missed double top & bottom, the price does not touch the support or resistance zone the second time, instead of reversing before.
Trading missed double top & bottom pattern
This price action pattern is rare to find on the chart than others, making it more accurate. To understand it better, let us look into the example of how you can trade this pattern effectively.
Many professional and profitable traders believe that 4hr is the best time frame to use for overall market trend and price movement, so we will switch our chart to 4hr and then make our support or resistance zone.
As missed double top and bottom is a reversal pattern, you will look for the missed double top when you see the market is heading upwards and can reverse anytime in the downward direction. While you will look for the missed double bottom when you see the market is heading downwards and can reverse anytime in the upward direction.
Missed double top
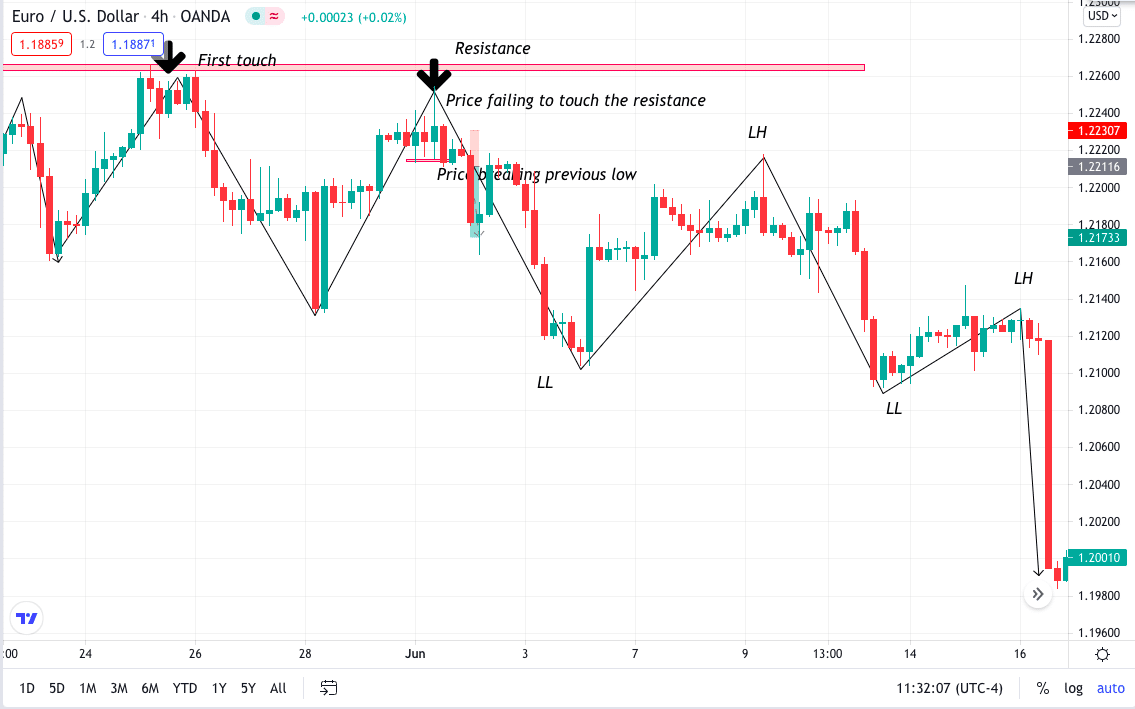
In the above 4hr EUR/USD chart, you can see the price was moving upwards and finally touched a resistance zone. Then the price was seen moving down, breaking the previous low giving the information that there is no potential buy or sell opportunity.
Moving forward, you can see the price then started its upwards journey to make a new high but could not touch the resistance zone. This clearly shows the missed double top pattern. The structure here on 4hr is the overall price structure; to take the trade, you need to move to a lower time frame, say 1hr or 30min.
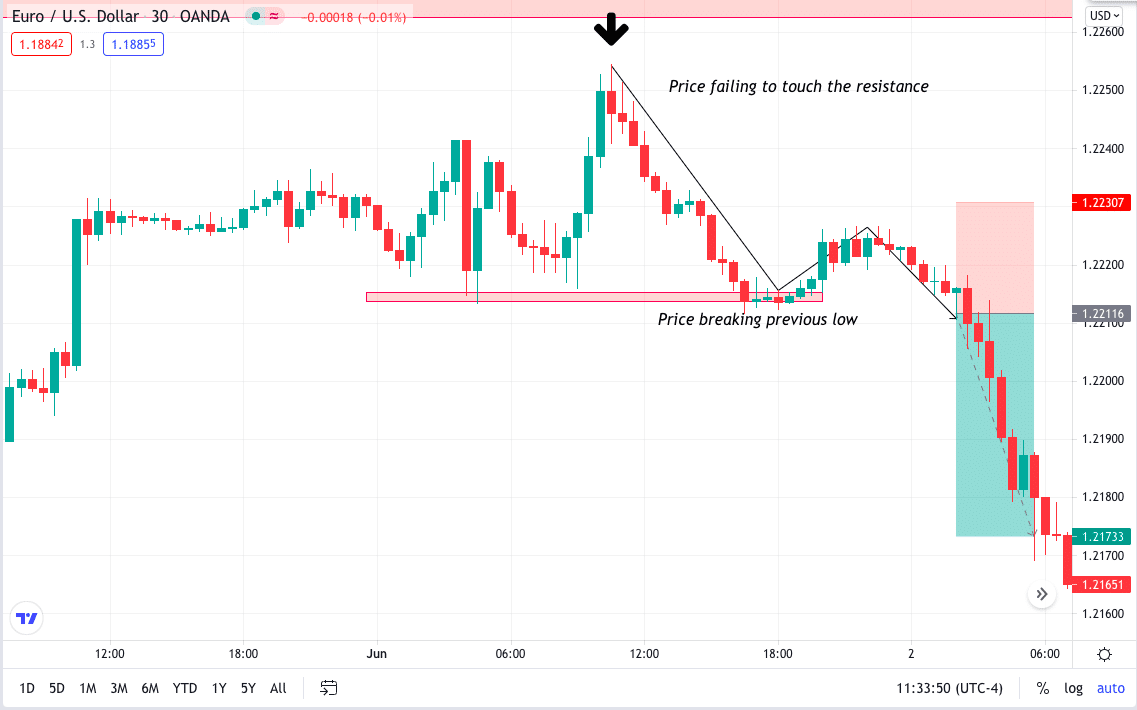
Here is a 30-min time frame. We can see the same structure price failing even to touch the resistance zone. This means there are potentially fewer buyers than sellers. A large number of bearish candles shows an increase in selling pressure. Now, as a price action trader, you will wait for a selling opportunity.
Entry
You should enter the market when you see the price breaking the swing low in 30min as shown in the above chart.
Take profit
You take profit should be placed either after 1:2 or 1:3 risk: reward or any nearest support in 4hr time frame.
Stop loss
Your stop loss should be at least 5-7 pips above the recent swing high at 30-min time frame.
Missed double bottom
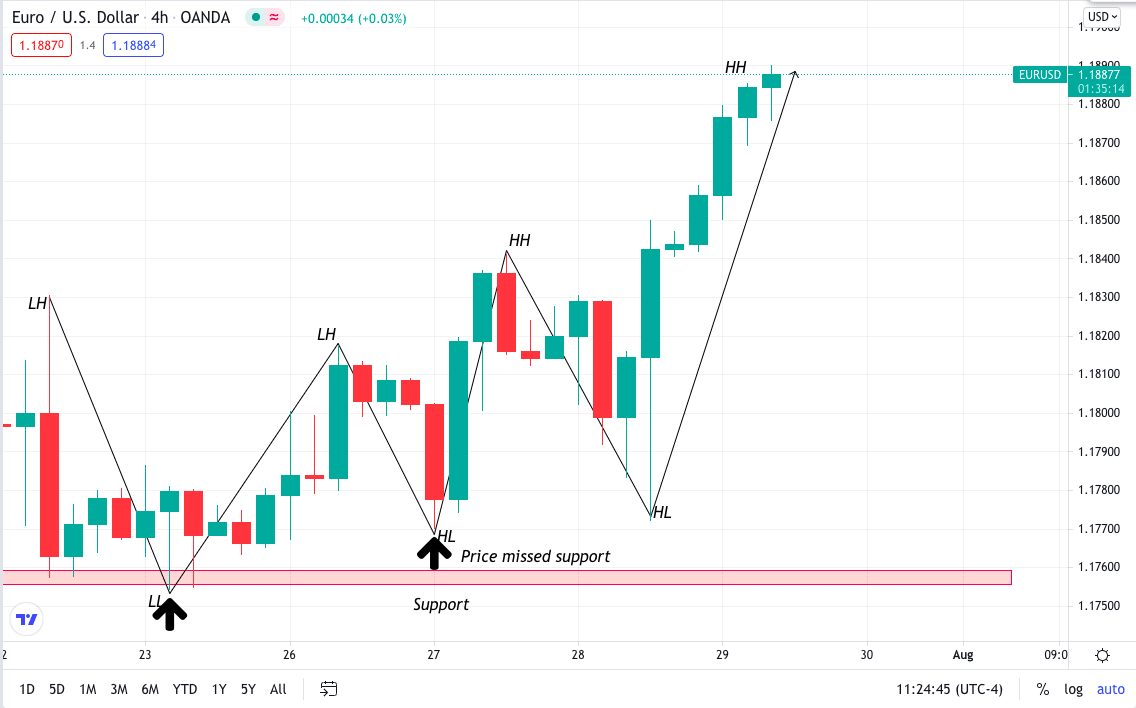
This pattern is just the opposite of the previous one. Here you will be looking for buying opportunities once you see the price has been uptrend for a while. In the above chart of EUR/USD in the 4hr time frame, you can see the price touched the support once and went up to make a swing high.
After the lower high formation, the price came back towards the support but could not touch it, making a higher low. The next formation is the higher high and higher low giving us reversal confirmation on 4hr.
Euro / US Dollar
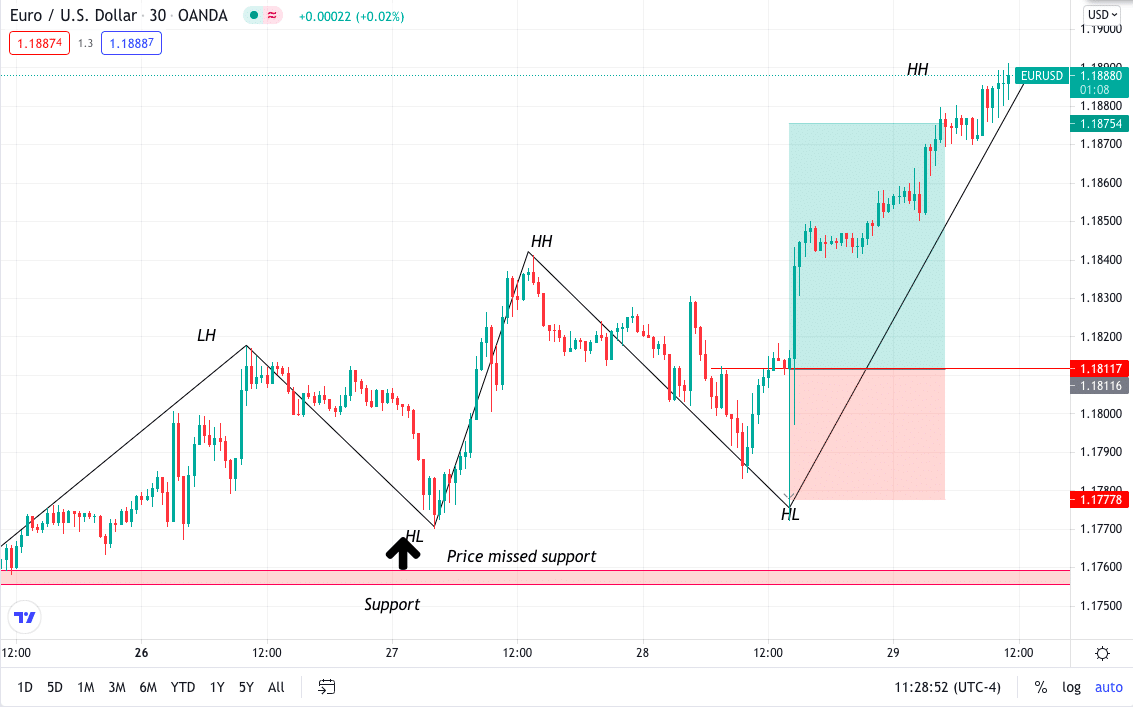
Moving to the 30-min time frame for rejection and trade execution, you can see a long wick candle rejecting the previous low. This rejection shows buying pressure, giving a potential buy signal.
Entry
You will enter the trade once you see the rejection on a 30min time frame; also, you need to see if the price is breaking the previous high.
Take profit
Your take profit will be 1:2 or 1:3 risk: reward. Always move your trade to breakeven after completing 1:1 risk: reward.
Stop loss
Your stop loss should be 5-7 pips below the previous low. In this example, the stop loss is a bit high because the rejection is because of the news.
Final thought
These patterns are very similar to double top & bottom, and they are tough to find on the chart. Although you can be sure to have some reasonable risk: reward potential trade setup when you find it.
Some traders use this strategy with the combination of indicators for more confluence. While using price action, always make sure you follow the overall market trend first by seeing a daily time frame followed by 4hr for structure and 30min for trade setup.