
Technical indicators are typical support in the financial market. Traders and investors use many technical figures to obtain the most accurate trading positions that allow making constant profits by participating in low-risk trades. Successful traders use indicators to create invincible trading strategies and determine the market context.
Hundreds of technical tools are available in the financial sector that use different calculations to obtain the market context. Each may contain different functionalities. This article includes a list of the best ten of them.
After completing this article, you will learn to use them besides knowing the basic functionalities.
The best ten forex indicators
We make this list depending on many factors such as availability on many platforms, easily applicable, easy to understand, signal accuracy, etc.
Moving average
MA is a typical indicator in the financial market that traders use to obtain the market context. It keeps updated on the price movement. You can customize it depending on different periods, opening & closing prices, and other parameters.
For example, you use a 50-day MA line on your chart.
- When the price remains above that MA line, it declares a bullish pressure.
- When the price candles cross and remain below that MA line declares a bearish pressure.
Another use of this line is common that is MA crossover. Where traders use two different lines when the small MA crosses above the extensive MA line, indicating price shifts to bullish, and the exact opposite crossover declares a start of a downward trend.

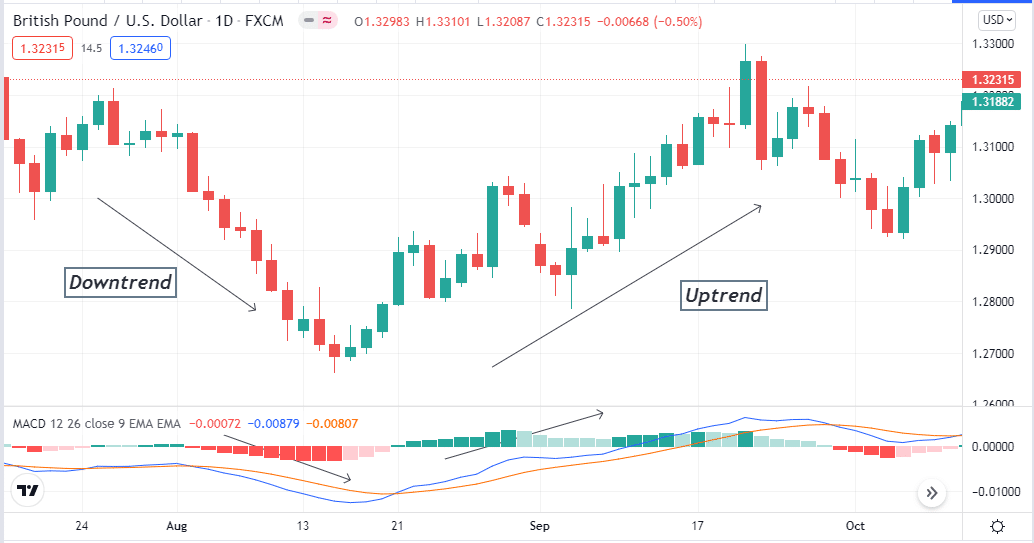
Moving average convergence divergence
MACD is another standard momentum indicator that applies to any trading instrument chart. You can consider it among the most popular tools for determining trends and price shifting points.
Its results in an independent window that contains two dynamic signal lines (blue and red), a central line, and histogram bars of different colors on both sides of the central line.
- When the price gets a bullish pressure, the dynamic blue line crosses above the dynamic red line.
- The exact opposite crossover occurs for a bearish pressure on the asset price.
Green histogram bars above the central line for an uptrend, and red histogram bars take place below the central line when the price remains on a bearish trend.
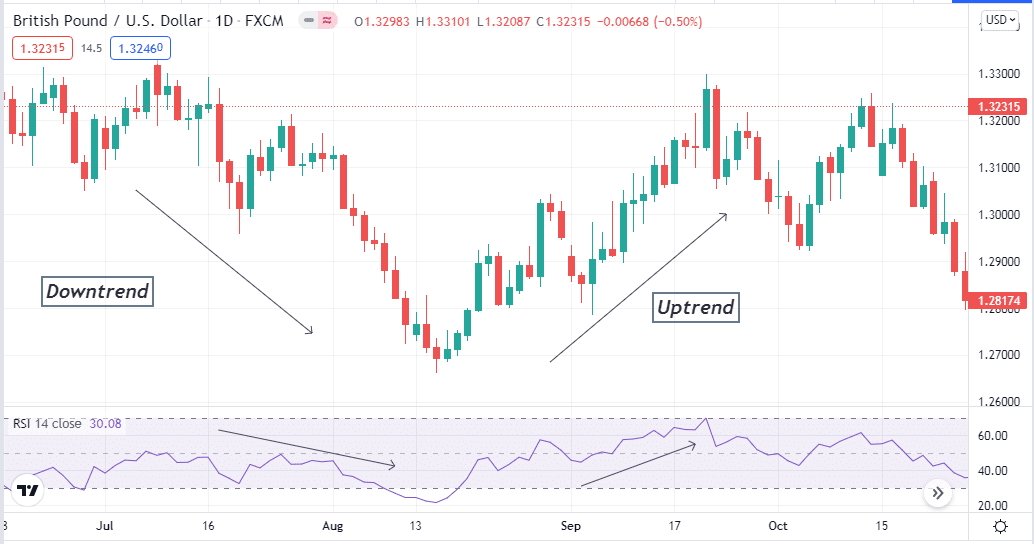
Relative Strength Index
The RSI indicator is another useful tool for financial market participants. It considers the historical and recent strengths and weaknesses of any asset price depending on the closing price of a specific period.
It shows reading in an independent window that contains three levels and a dynamic signal line.
- When the dynamic line remains above the central (50) level it declares sufficient bullish pressure on the asset price. If it reaches the upper (80) or above, it indicates an overbought price condition.
- Conversely, when the dynamic line crosses below the central (50) line, it indicates sufficient bearish pressure, and below the lower (20) line, it declares the price remains in an oversold condition.
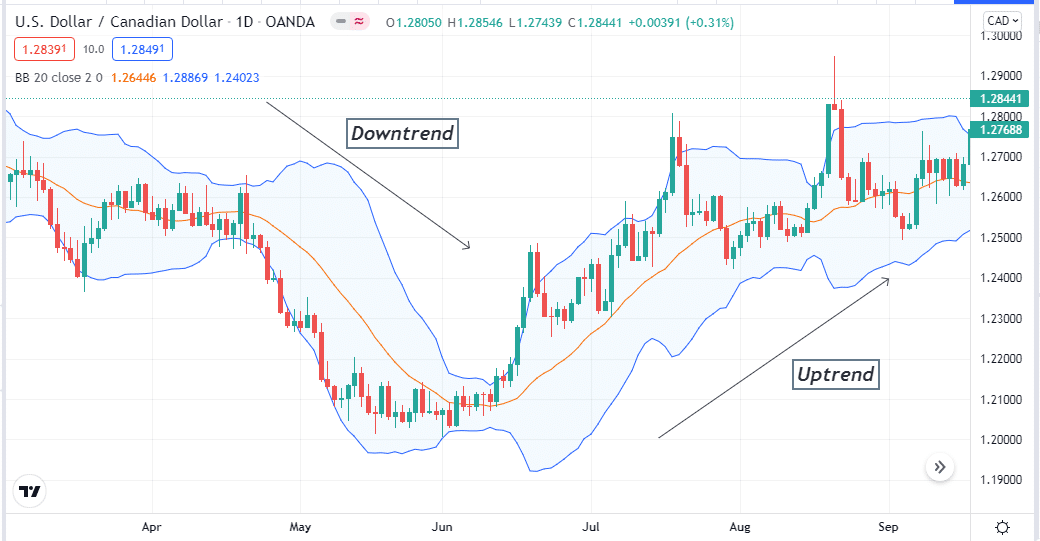
Bollinger Bands
The BB draws standard deviation levels on both sides of an SMA price of certain assets by three bands; these bands represent volatility in the asset price.
- The upper one is a dynamic resistance level, and the lower one is a dynamic support level.
- When these bands get closer, maybe a breakout is coming.
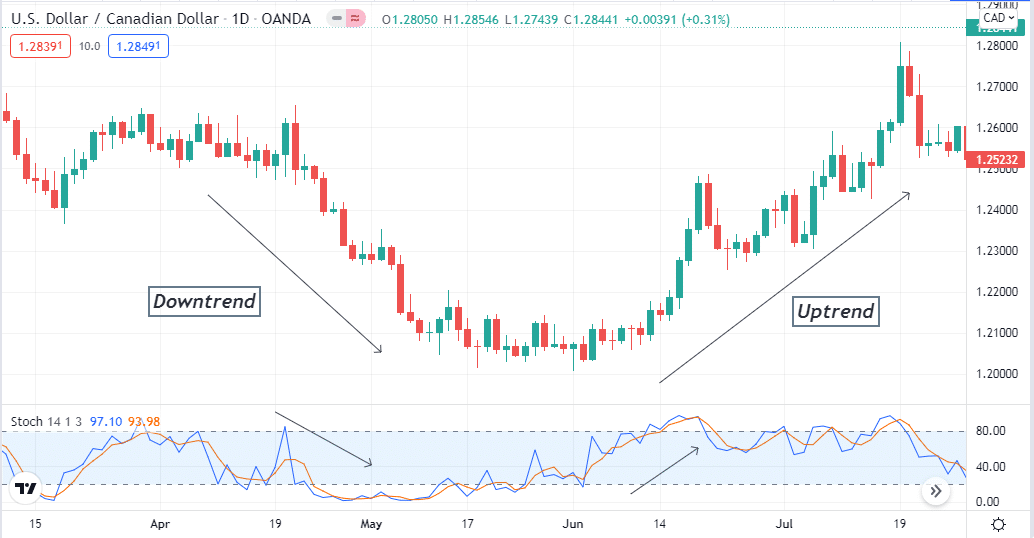
Stochastic oscillator
It is another useful technical tool for market participants that contains two dynamic lines and different levels. It applies to any trading asset. When the dynamic blue line crosses above the dynamic red line, it declares a bullish pressure and vice versa for the opposite crossover between these signal lines.
- These lines above or at the upper (80) line indicate the price is at an overbought condition.
- Meanwhile, an oversold condition when these lines are at the lower (20) line or below it.
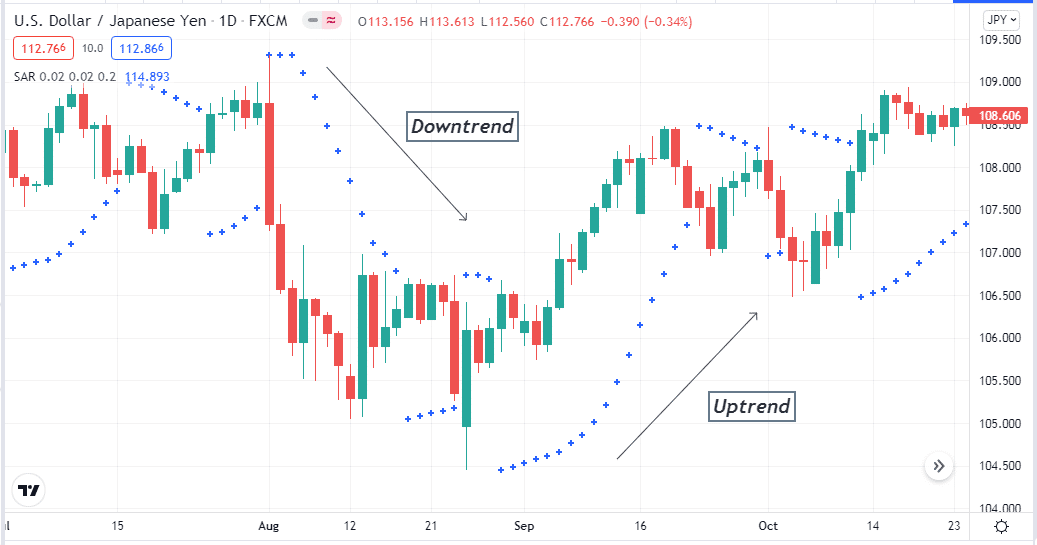
Parabolic SAR
The Parabolic SAR is another top trading tool for market participants. It identifies the trend and trend-changing phases by dots on above or below price candles.
- When the price moves down, a dot takes place below and continues to make a series of dots till the price remains on an uptrend.
- The dot switches to the upside when a valid high takes place and a series of dots above price candles for a downtrend.
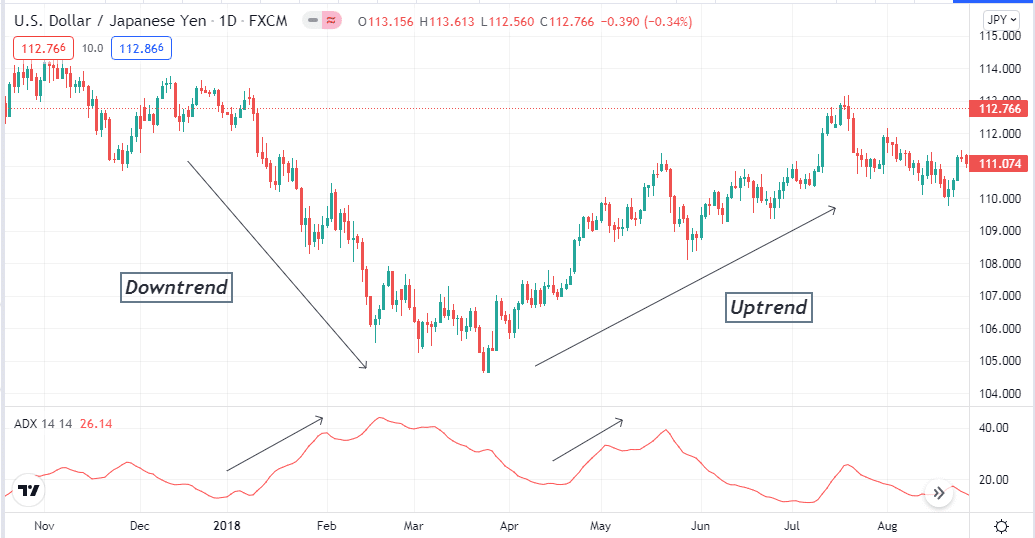
Average directional index
It is a typical indicator used to determine the current trend’s strength. It shows readings on an independent window that contains a dynamic signal line.
- When the ADX value exceeds 20, it declares sufficient current trend strength. It continues to increase with increasing participants’ actions.
- The indicator’s value drops as the trend gets weaker.
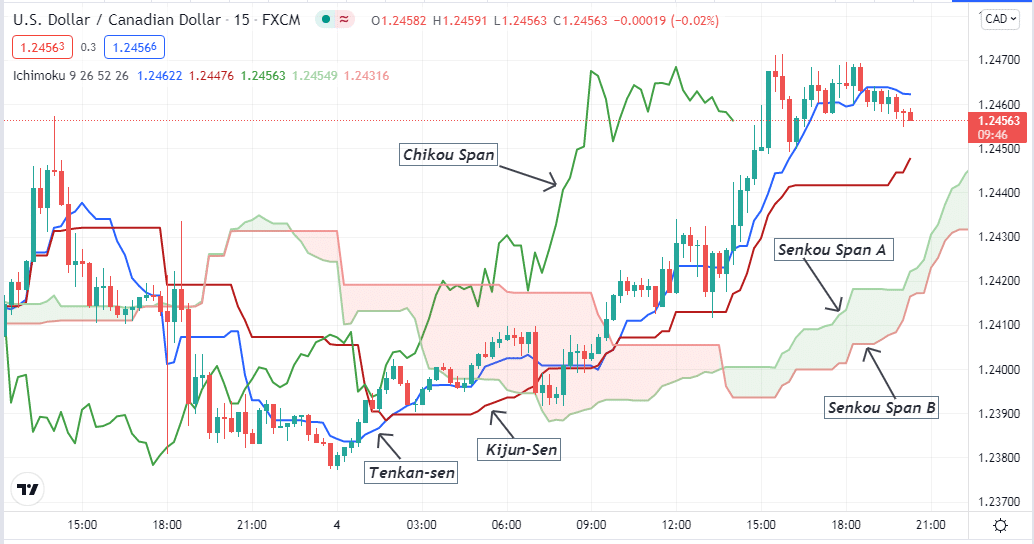
Ichimoku cloud
The Ichimoku is another popular indicator to generate trade ideas for financial trades. This tool contains Tenkan-sen, Kijun-sen, Chikou span, Senkou span A, Senkou span B. The crossover between Tenkan-sen and Kijun-sen declares switching trend positions.
- The cloud is green below price candles and declares an uptrend.
- The cloud becomes red when the price movement is bearish.
Signal strength is assessed based on three factors:
- How far is the price relative to the cloud?
- How far is Chikou Span concerning the cloud?
- How far is the intersection of the lines concerning the cloud?
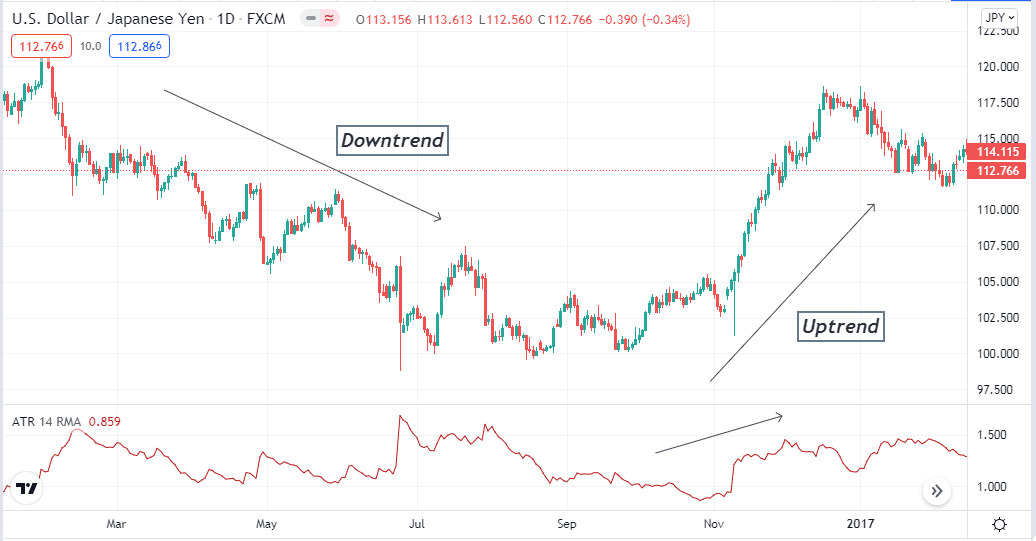
Average true range
One more volatility indicator is used to determine entry/exit positions. It declares how volatile the trading instrument is during a specific period. It is a handy tool to determine any trade’s opening position and SL for the executing trade.
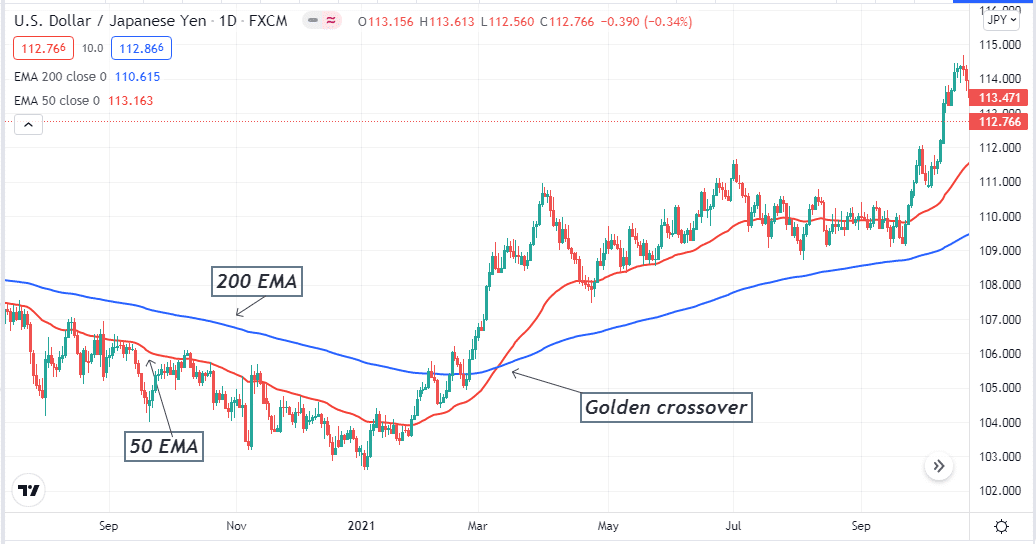
EMA
This technical figure is more sensitive to determining the price movement of any trading asset. A common use is a golden crossover between EMA 50 and EMA 200.
- When the 20 crosses above the 200, it declares a bullish trend, and the results are best on daily charts of trading instruments.
- The exact opposite crossover between these lines indicates a downtrend.
Final thought
These are the top indicators that market participants use. You can also use them to execute commodities, stocks, etc. These technical figures only represent the market context by calculating different technical data, while many fundamental factors affect asset prices. We recommend combining the fundamental data with these tools to catch the most potential positions.


