
Trading indicators are an unavoidable part of financial investors. It is common for market participants to rely on many trading tools while making trade decisions. So it makes sense that crypto investors also choose many technical indicators to generate potentially profitable trade ideas.
However, different indicators depend on market data and use different calculations to obtain the market context. So it is not wise to start using any technical tool in live trading without having a particular level of understanding. This article lists and describes the top ten remarkable technical indicators to obtain the market context.
Top ten crypto trading indicators
When choosing any tool, it is mandatory to understand its components and effective using procedures. The top ten tools for crypto trading are:
- Moving averages
- Bollinger Bands
- Relative Strength Index (RSI)
- Parabolic SAR
- Moving Average Convergence Divergence (MACD)
- Average Directional Index (ADX)
- Directional Trend Index (DTI)
- Relative Vigor Index (RVI)
- Volume indicator
- Vortex indicator (VI)
Moving averages
MA indicators are among the most familiar technical tools in the financial market. It usually collects different data of price candles, such as open, close, high, low, etc., and shows the average movement of any particular period. Several MAs are available, including EMA, WMA, SMMA, SMA, HMA, QEMA, etc.
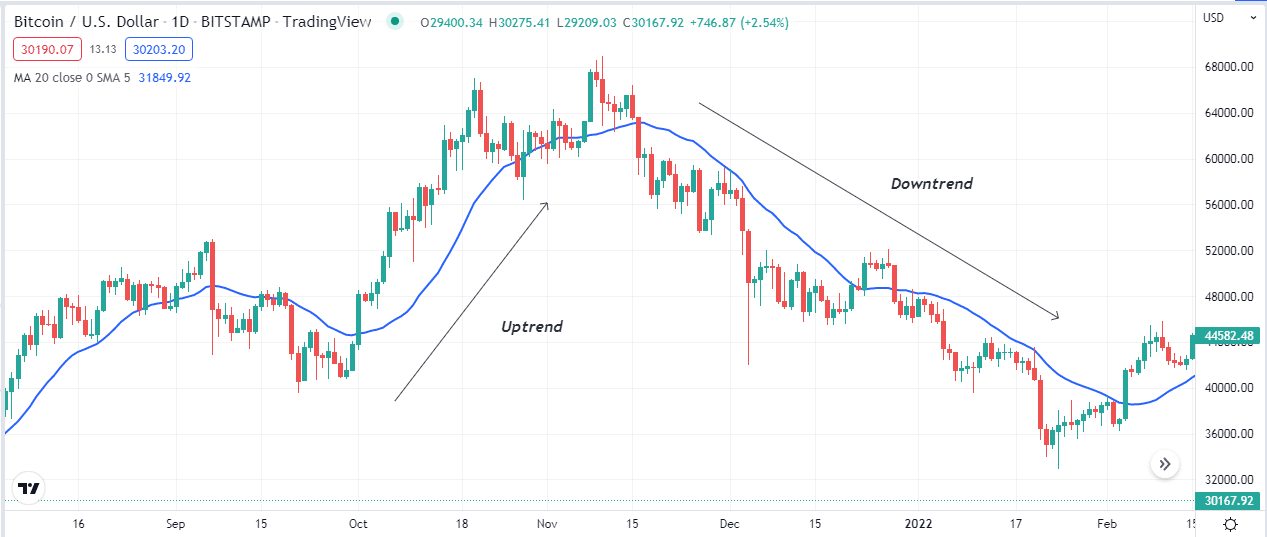
Investors can customize the period parameter and color according to their desire. Moreover, many financial investors use this technical indicator independently or combine it with other technical indicators and tools while making trade decisions.
Bollinger Bands
BB is among one of the most popular technical indicators. This indicator contains three different dynamic lines that you can use as support resistance levels, and the price remains on specific lines declaring a particular market context.
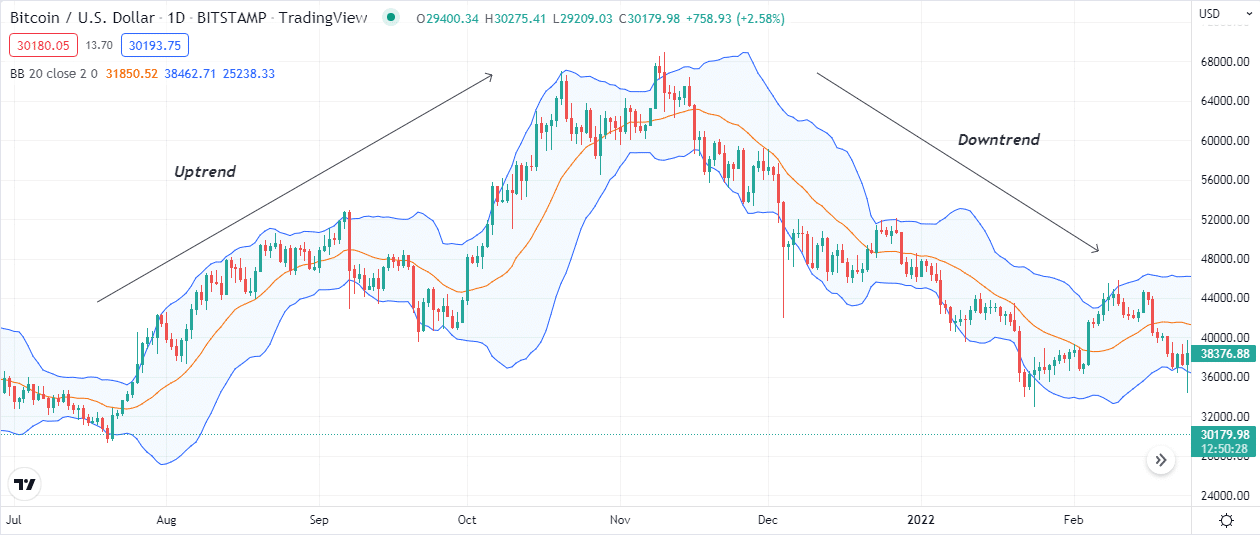
Moreover, this indicator is so popular among financial investors for its attractive features of determining squeeze, breakouts, trends, overbought, oversold levels etc. You can execute constantly profitable trades using this BB indicator effectively.
Relative Strength Index
The following top technical indicator for crypto trading is the relative strength index or RSI. This indicator shows an independent window with a dynamic signal line and different levels; when the price reaches above the central line declaring bullish price pressure on the asset price and vice versa.
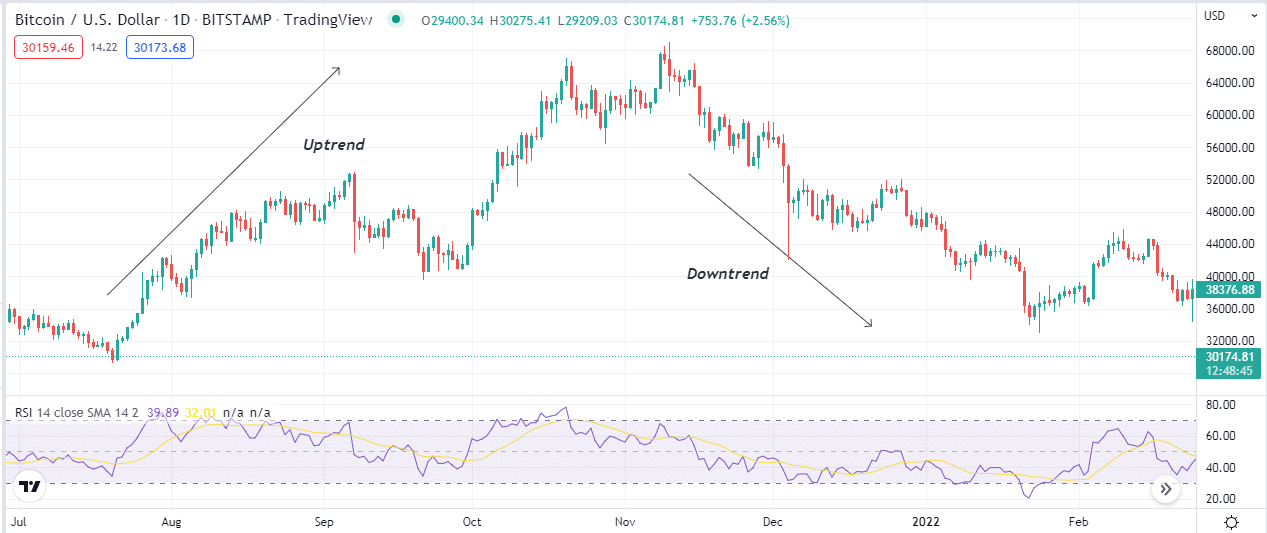
The price remains overbought when the dynamic line comes to the upper (70) level or above. Meanwhile, any reading near the bottom (30) level declares declining price pressure or seller domination at the asset price.
Parabolic SAR
The parabolic SAR is another standard and straightforward technical indicator in the financial market. It uses dots above or below price candles to declare price pressure. The Parabolic SAR dot appears above/below when the price creates a valid swing high/low.
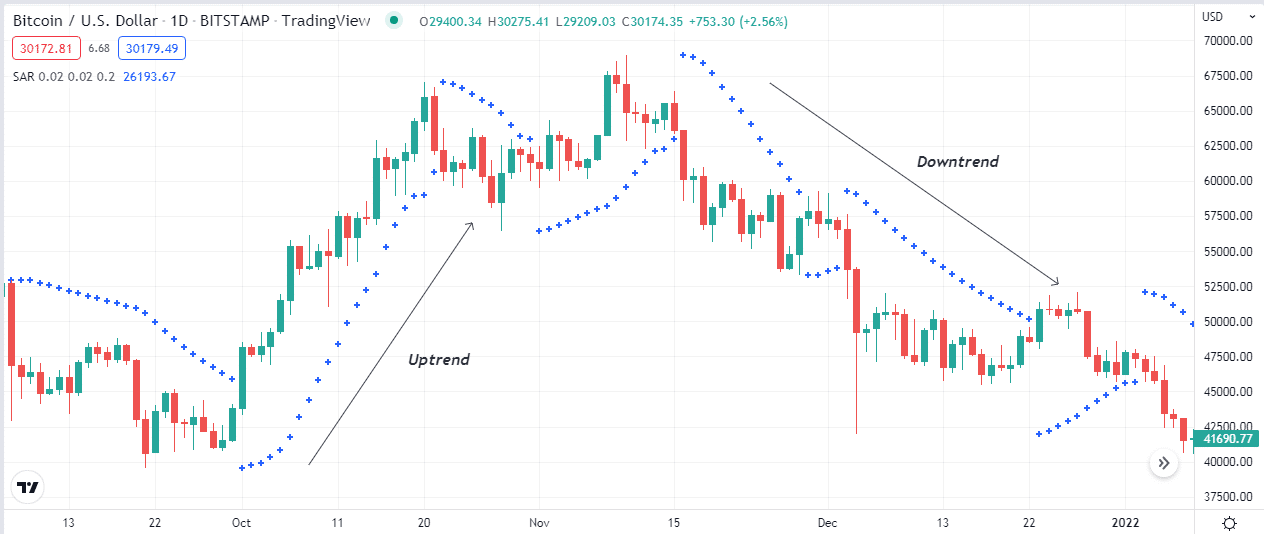
For example, when the price creates a swing low, the indicator creates a dot below that swing point and starts making a series of dots till the price moves in the uptrend. Meanwhile, when the indicator marks a valid swing high, it creates a dot above the swing point and creates a series of dots till the price moves in the downtrend.
Moving Average Convergence Divergence
It is one of the most common technical indicators in the financial market. This indicator results in an independent window containing two dynamic lines and histogram bars of different colors on both sides of a central line. When the dynamic blue line reaches above the dynamic red line declares a positive price force and vice versa for the exact opposite crossover.
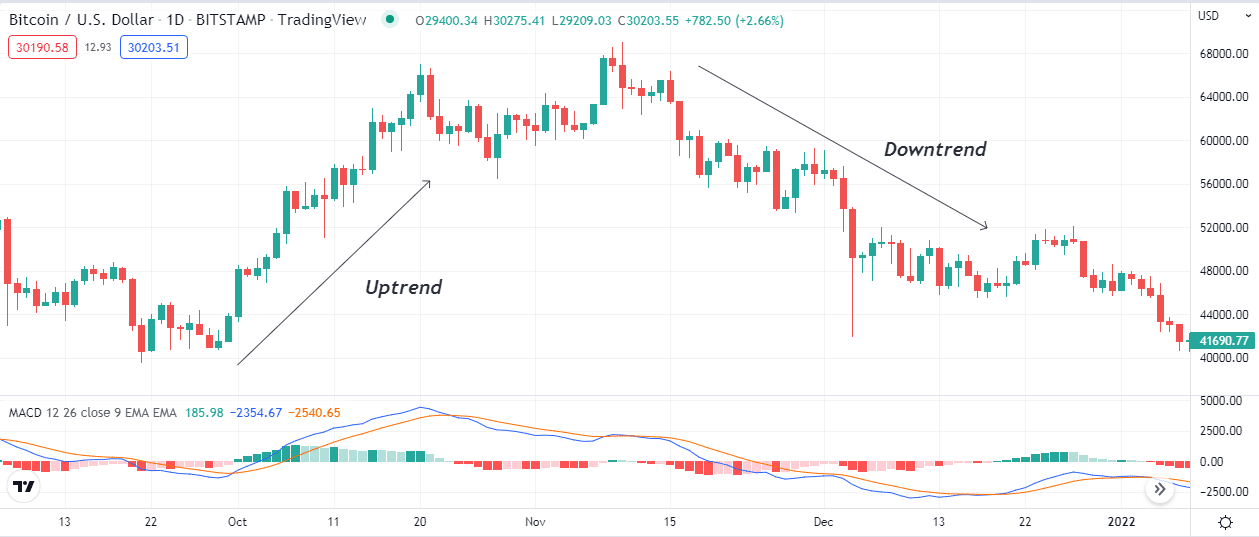
Meanwhile, green histogram bars above the central line confirm buyers’ domination at the asset price. It indicates sellers’ domination in the asset price when red histogram bars take place below the central line of the MACD indicator window.
Average Directional Index
It is a straightforward indicator in the financial market that measures the current trend’s strength. This indicator shows results in an independent window containing a dynamic line. The dynamic line increases in value, indicating the strength.
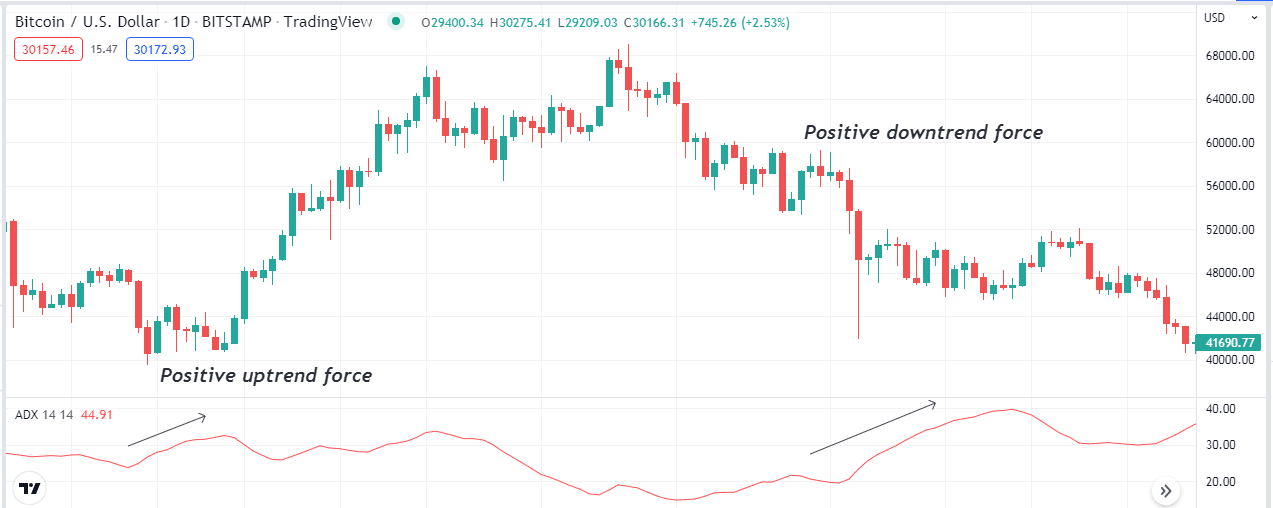
For example, the price enters an uptrend, and the dynamic line of the ADX indicator window reaches above 20, declaring sufficient bullish pressure on the asset price. When the price enters consolidating phases or sideways and volume decreases, the ADX value drops or starts sloping on the downside.
Directional Trend Index
It helps generate trade ideas on crypto assets. This indicator results in an independent window containing a dynamic line that floats at different levels.
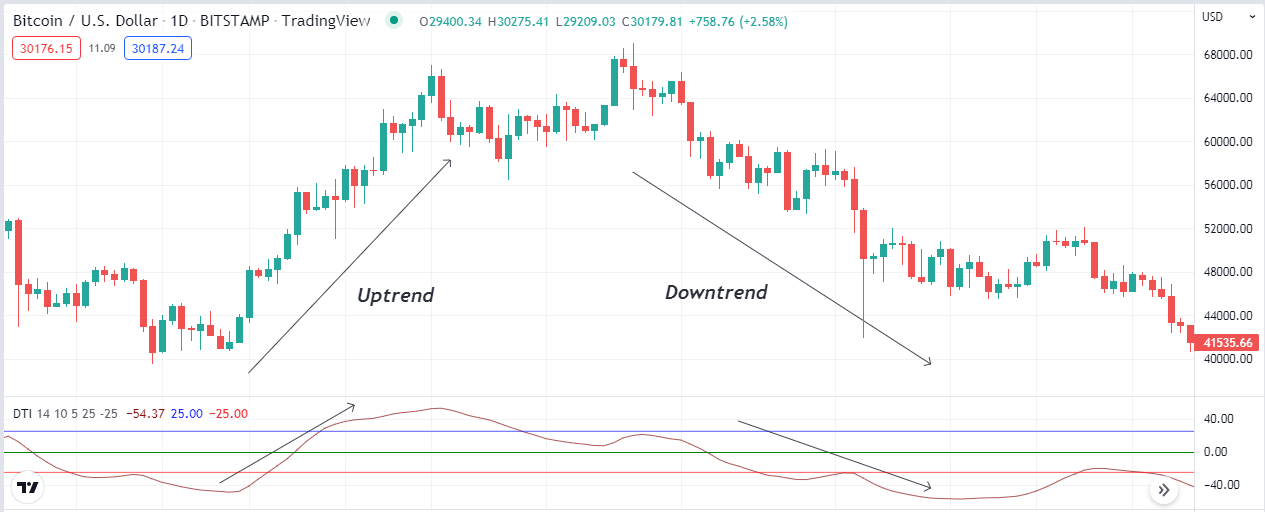
When the reading is above +10 declares positive price pressure, and above +25 indicates the price facing extreme buy pressure. Meanwhile, when the price has sufficient declining pressure, the reading comes below -10, and any reading below -25 indicates intense sell pressure.
Relative Vigor Index
It is another popular technical indicator for crypto traders. It shows results in an independent window containing two dynamic signal lines: green and red lines.
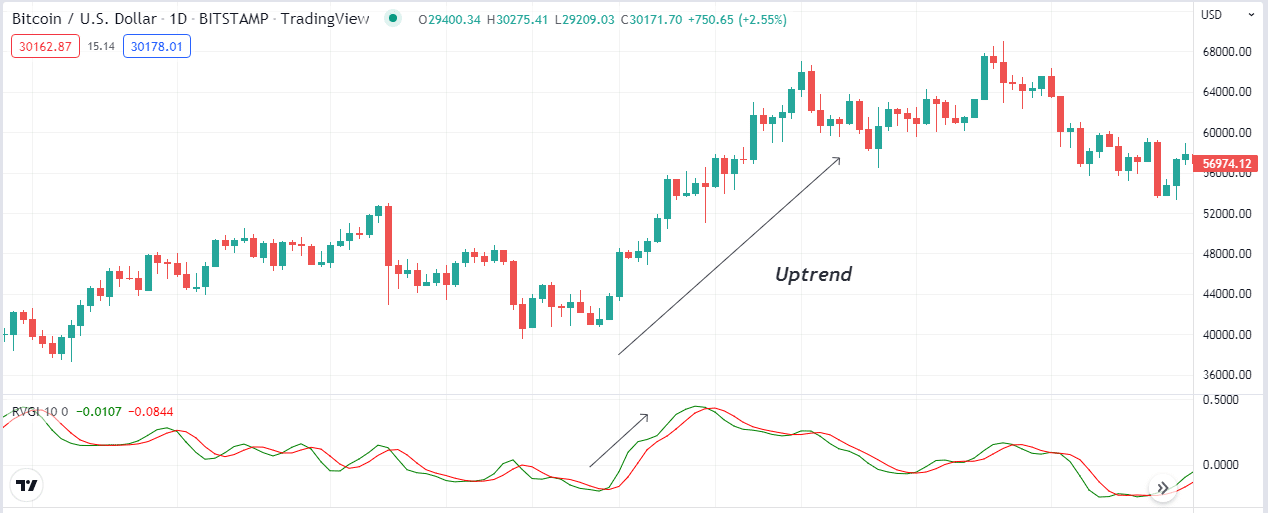
When the green line reaches above the red line declares positive force on the asset price and vice versa when the exact opposite crossover occurs. You can also use the diversion of these dynamic lines to generate trade ideas.
Volume indicator
It is a common and universal technical indicator that suits almost all trading instruments for financial investors.
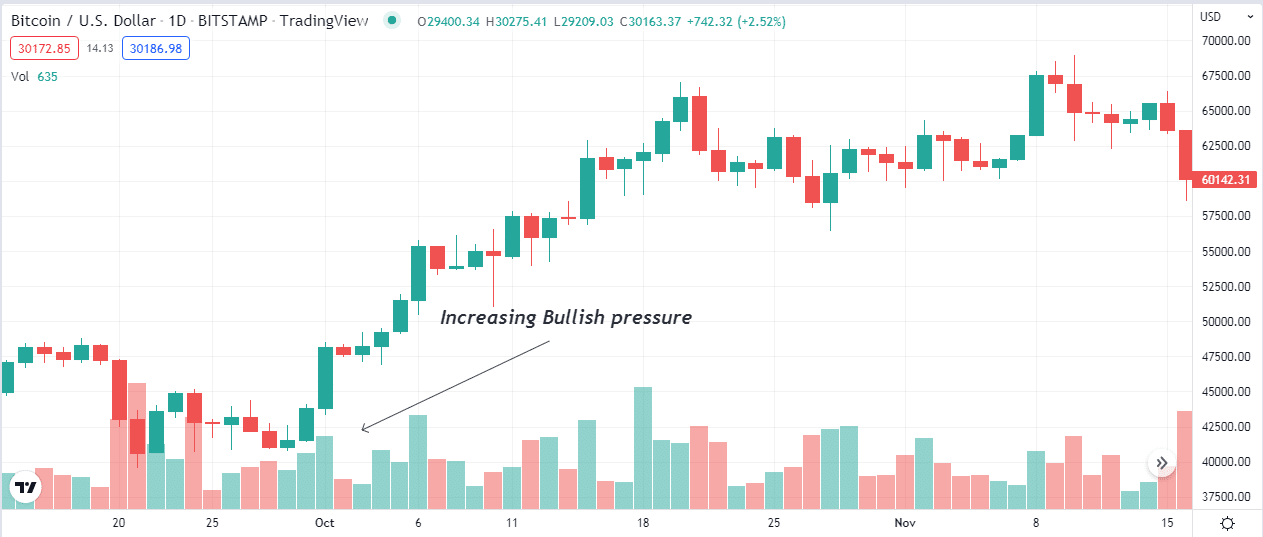
This indicator creates green and red histogram bars declaring bullish and bearish momentums of the asset price. The size of histogram bars also varies with force.
Vortex indicator
The last of our top ten potential indicators is the Vortex Indicator, or VI. This indicator contains two dynamic (VI+ and VI-) lines in an independent window.
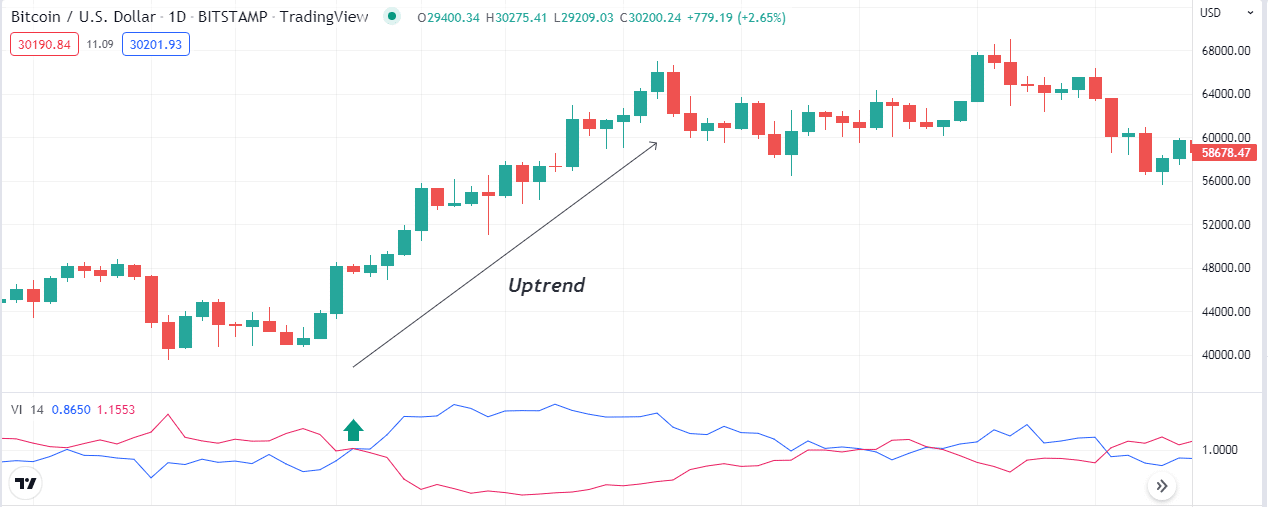
Here, +VI is blue and -VI is maroon. The blue line surpasses the maroon line on the upside, indicates bullish momentum, and the exact opposite crossover declares bearish momentum.
Final thought
Finally, these are the top potential technical indicators in the financial market that you can undoubtedly use for crypto trading. We suggest mastering concepts by practicing before starting trading crypto using any of these indicators above.


