
Making trade decisions depending on candle formations is common among financial traders. Each candle holds information about participants’ actions during that period. So it becomes easier to predict the future movement of financial assets by following that info. The hanging man is a standard candle formation that financial traders consider to make their trade decisions.
However, it is obligatory to learn the functionality and characteristics of any candle before using it to execute successful trades. This article will introduce you to the hanging man candle. Additionally, it contains this candle’s trading strategies besides listing the top pros and cons.
What is the hanging man candle?
A single candle signals a bearish reversal when it takes place near the finish line of an uptrend. This candle formation reflects increasing selling interest on the asset. This candle type has a petite body with no or tiny upper wicks. Meanwhile, it contains a lower wick that will be at least twice the body size of the candle.
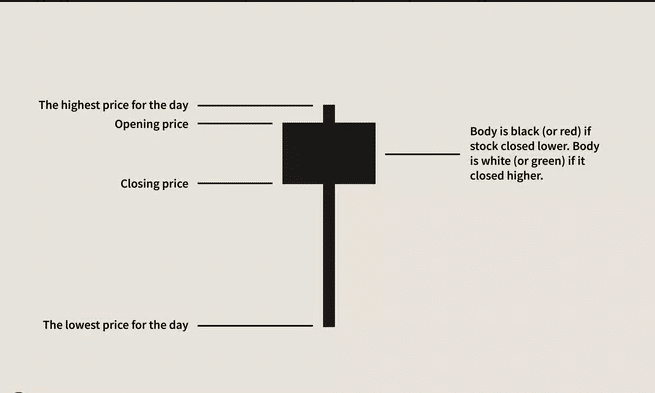
The body can be green or red, but potentiality is high when it occurs on a downtrend. The hanging man with a green body is less potent than the hanging man with a red body. When the same candle formation takes place at a downtrend, traders define that as a “hammer” candlestick, which generates signals of upcoming buying pressure on the asset. The hanging man candle also sometimes signals a continuation of a downtrend.
So identifying criteria of a hanging man candle are:
- Form near the top of an uptrend
- No or tiny upper wick
- Long lower wick
- The body will be red for a bearish-hanging man (more reliable)
How to trade using hanging man?
Executing trades using this candlestick pattern is easy, which you can complete by following some simple steps.
Step 1.
The first step is to identify the long-term trend. Don’t enter the market against long-term trend direction using this pattern.
Step 2.
Spot the candle at your target chart and mark ideal entry/exit points. Remember, the hanging man candle always provides short trading ideas.
Step 3.
This step uses some supporting indicators, such as MA crossover, RSI, MACD, parabolic SAR, Fibonacci retracement tool, etc., to confirm the price direction and determine entry/exit positions.
Step 4.
Place trade according to your strategy when you get a trade idea by combining the supporting technical info and candlestick pattern.
Step 5.
Follow risk management rules when executing any trading position. Try to take 2-5% risk of your trading capital for open trades, not much more than that.
Step 6.
Close your trade according to your trading strategy.
A short-term trading strategy
In our short-term trading technique, we use two different EMA lines besides the candlestick to determine more precious entry/exit positions. Our trading strategy contains EMA 10 (green) and EMA (30).
Crossover between these lines will help you to make a complete trading method. This strategy suits any trading asset with sufficient volatility. We recommend using a 15 min or hourly chart to obtain satisfactory results using this strategy.
Bullish trade scenario
The hanging man is a hammer candle when it takes place after a downtrend. After applying EMA indicators on your target asset chart, spot the hammer candle near the finish line of a downtrend, then observe the EMA lines.
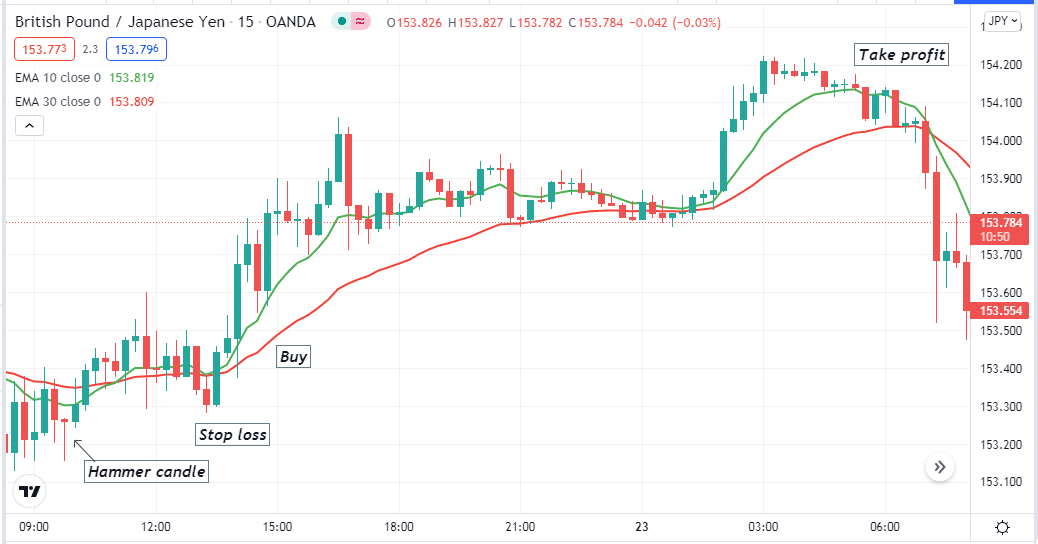
Entry
Enter a buy trade when the green EMA line crosses above the red EMA, and both are heading toward more upside after price movement creating a hammer candle.
Stop-loss
Place an initial stop loss for your buy order below the recent swing low.
Take profit
Close your buy order when the green EMA crosses below the red EMA.
Bearish trade scenario
The hanging man candle generates bearish reversal trade ideas. After applying EMA indicators on your target asset chart, spot the hanging man candle near the finish line of an uptrend, then observe the EMA lines.
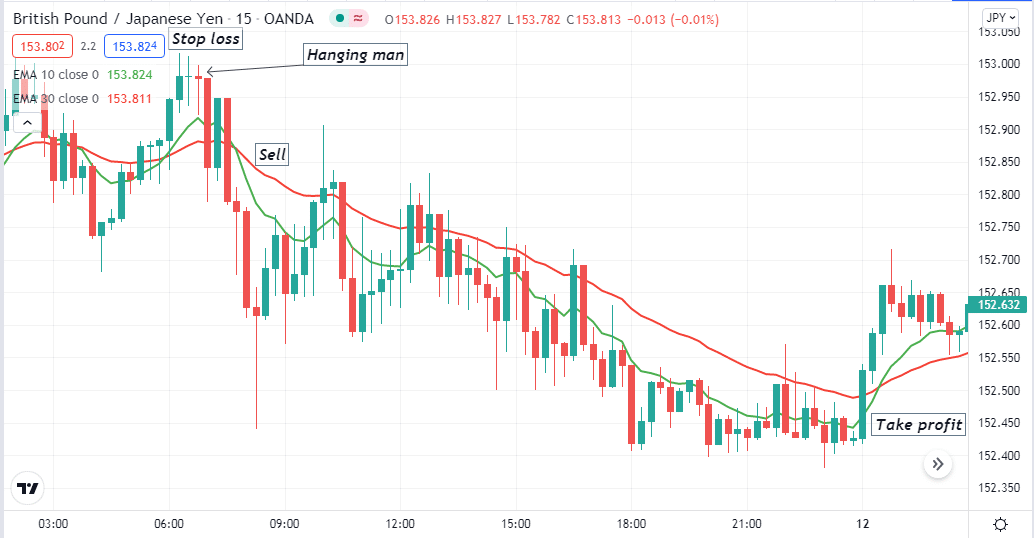
Entry
Enter a buy trade when the green EMA line crosses below the red EMA, and both are heading toward more downside after price movement creating a hanging man candle.
Stop-loss
Place an initial stop loss for your sell order above the recent swing high.
Take profit
Close your sell order when the green EMA crosses above the red EMA.
A long-term trading strategy
Our long-term trading strategy involves using a popular momentum indicator, the MACD, besides the candlestick pattern. We recommend applying this trading method on an H4 or above time frame chart to get good long-term trade ideas.
Bullish trade scenario
Spot the hammer candle near the ending of a downtrend. Then observe the MACD window:
- The dynamic blue line crosses above the dynamic red line.
- MACD green histogram bars take place above the central line.
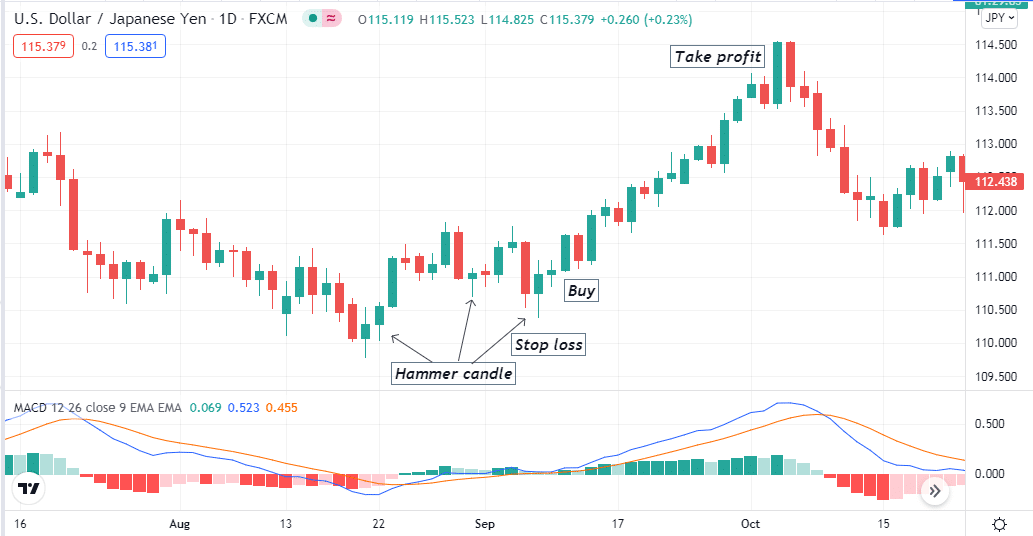
Entry
When these criteria above match your target asset chart, it signals an upcoming bullish pressure on the asset price. It is an ideal place to make a buy order.
Stop-loss
Your sell order’s initial stop loss level will be above the current swing high.
Take profit
You can continue the buy order until the current bullish trend remains intact. Close the buy order when:
- The dynamic blue line crosses below the dynamic red line on the MACD window.
- MACD red histogram bars take place below the central line.
Bearish trade scenario
Spot the hanging man candle near the ending of an uptrend. Then observe the MACD window:
- The dynamic blue line crosses below the dynamic red line.
- MACD red histogram bars take place below the central line.
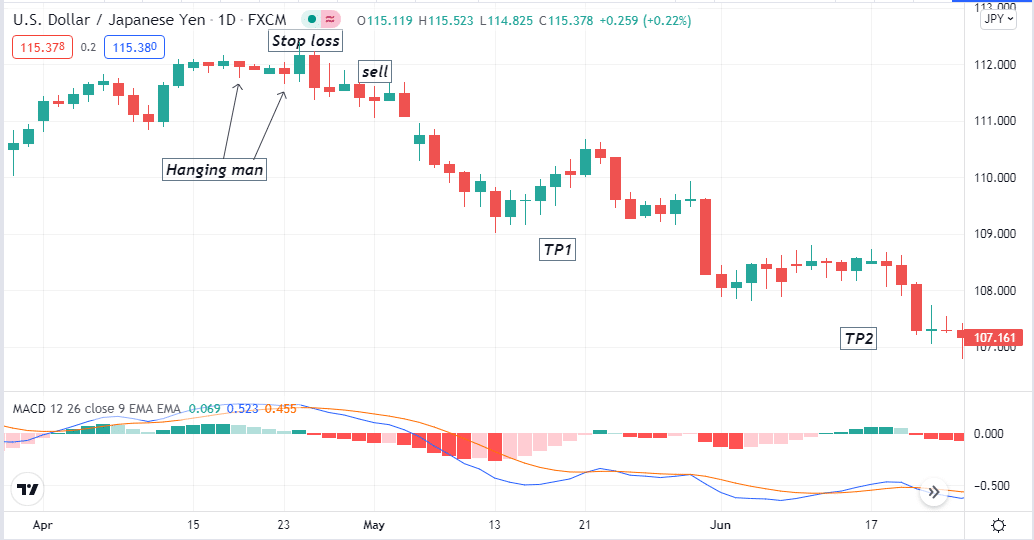
Entry
When these criteria above match your target asset chart, it signals an upcoming bearish pressure on the asset price. It is an ideal place to make a sell order.
Stop-loss
The initial stop loss level for your sell order will be above the current swing high.
Take profit
You can continue the sell order until the current bearish trend remains intact. Close the sell order when:
- The dynamic blue line crosses above the dynamic red line on the MACD window.
- MACD green histogram bars take place above the central line.
| Pros | Cons |
| Allow you to make frequent trading positions. | Require the use of other technical tools and indicators to determine entry/exit positions. |
| This candle generates trade ideas with a considerable success rate. | Trade ideas using this pattern can fail due to other fundamental reasons. |
| You can trade many assets using this candle. | Making trade decisions depending on only one candle is not very wise. |
Final thought
Finally, no ‘holy grail’ in the financial market will promise you a hundred percent profitability. This candlestick, the hanging man, is a very potential pattern in the financial market. If you use it correctly, then this candlestick will enable you to make consistently profitable trades.