
Ichimoku Cloud trading method is different from the conventional technical analysis as it is an indicator and a whole trading system. Many successful traders worldwide only take investment decisions based on Ichimoku Cloud only.
On the other hand, the indicator includes several tools like Tenkan Sen, Kijun Sen, Kumo Cloud that need a detailed understanding of these before using it. The following section is for you if you are keen to build a trading strategy based on this tool.
What is Ichimoku Cloud?
It is a simple technical indicator that can show a trading instrument’s reversal and continuation patterns. The uniqueness of this indicator is that it is combined with multiple elements that help traders to see the market from various angles.
In general technical indicators use a fixed mathematical calculation, and the result with this indicator comes automatically once the price reaches a level based on the indicator.
On the other hand, some dynamic indicators like moving average and Bollinger Bands change the value with the price change. The Ichimoku Cloud uses tools where the Kumo Cloud works as a significant reversal level. Moreover, the near-term support and resistance pressure come from dynamic Kijun Sen and Tenkan Sen.
Let’s see what these elements mean for crypto-traders:
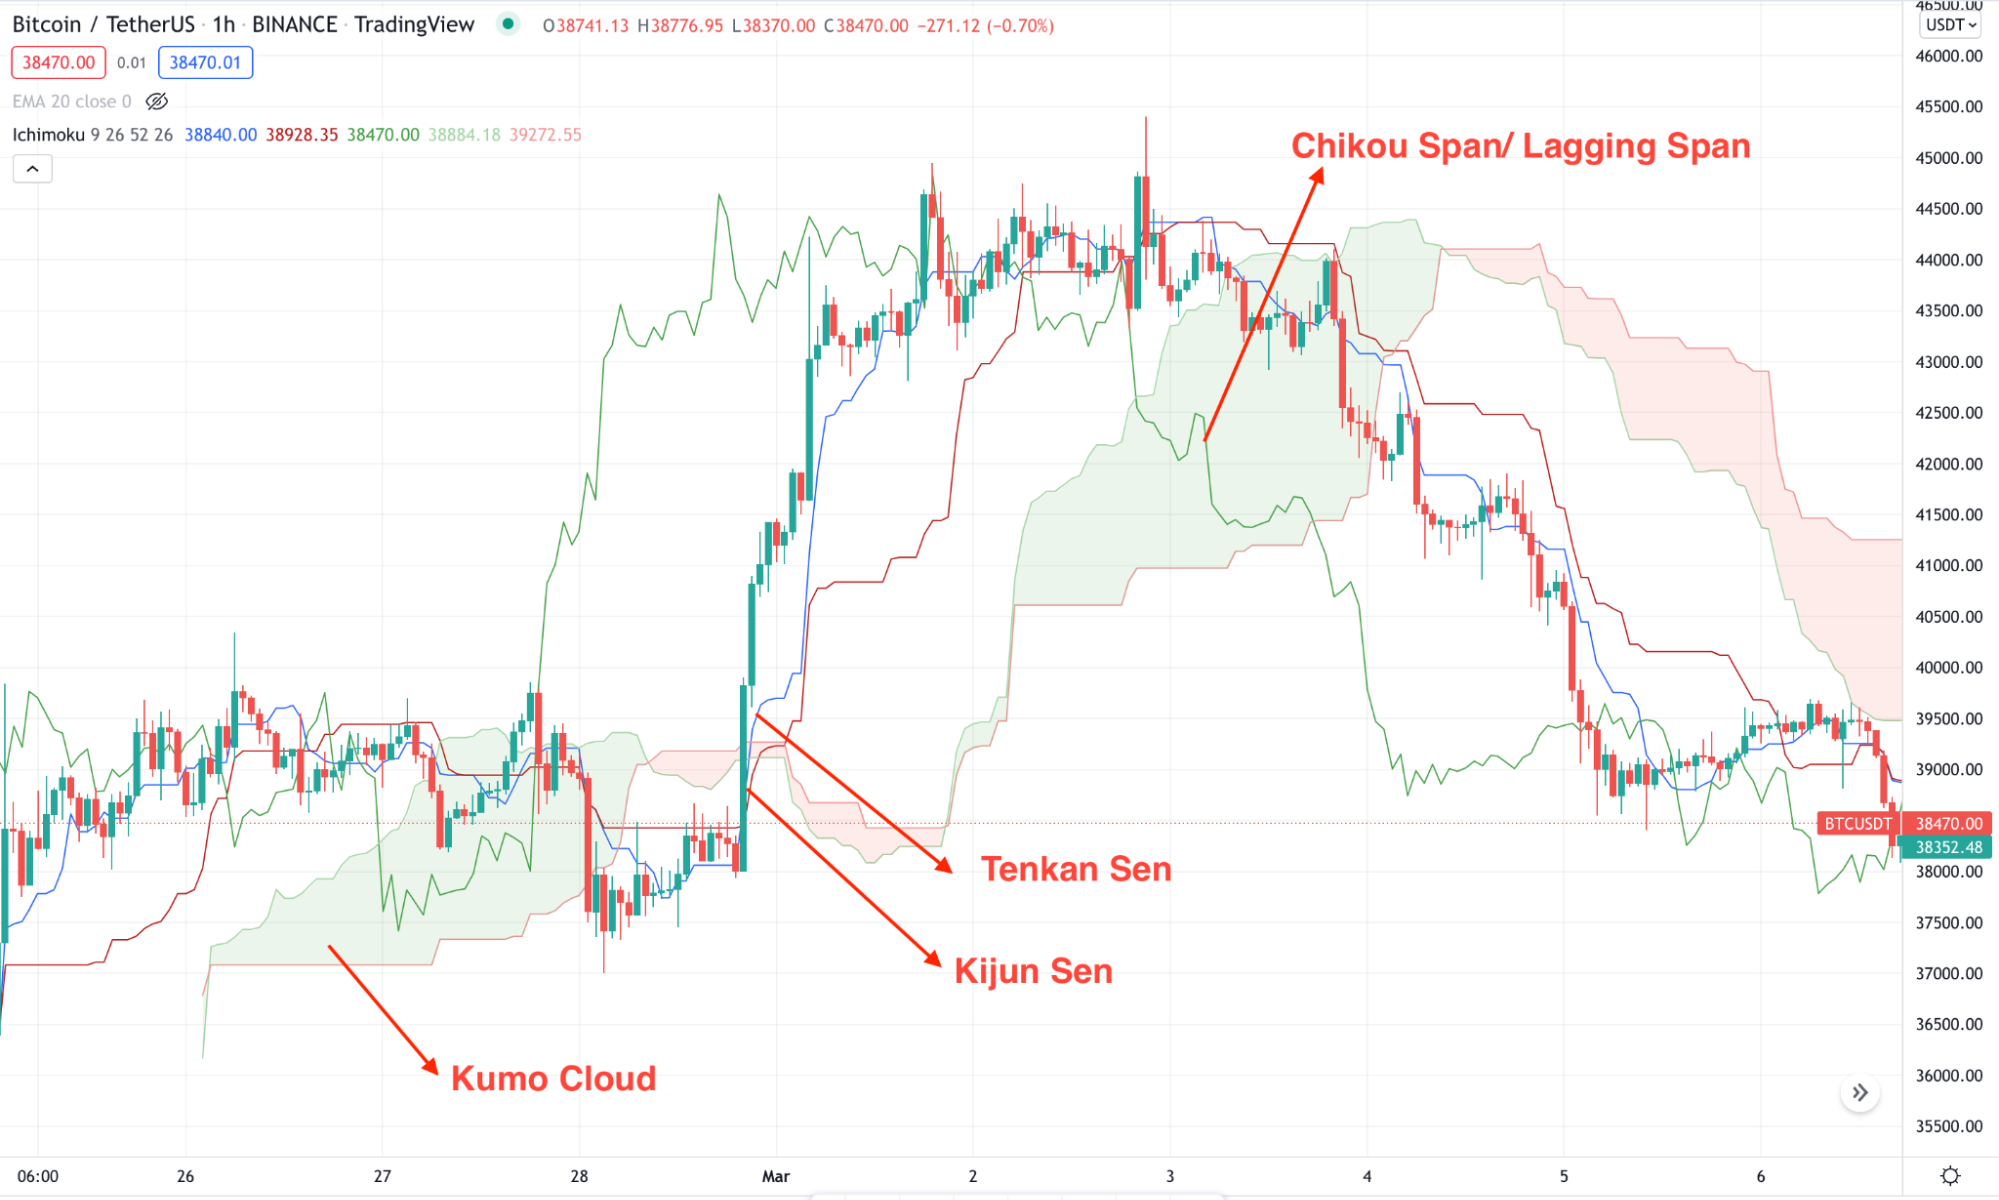
- Tenkan Sen
The average price for the last nine candles is high and low. For traders, it works as a dynamic support or resistance level, which shows the market sentiment of short-term traders.
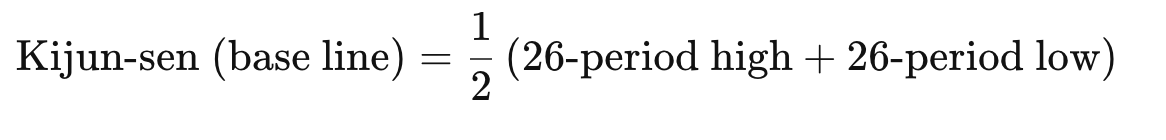
- Kijun Sen
It is the second phase of support or resistance level that shows the market sentiment of medium-term traders. It shows the average price for the last 26 candles. The calculation of this method is shown below.
- Senkou Span A
The midline of the Tenkan and Kijun Sen line shows the long-term perfective of a trend.
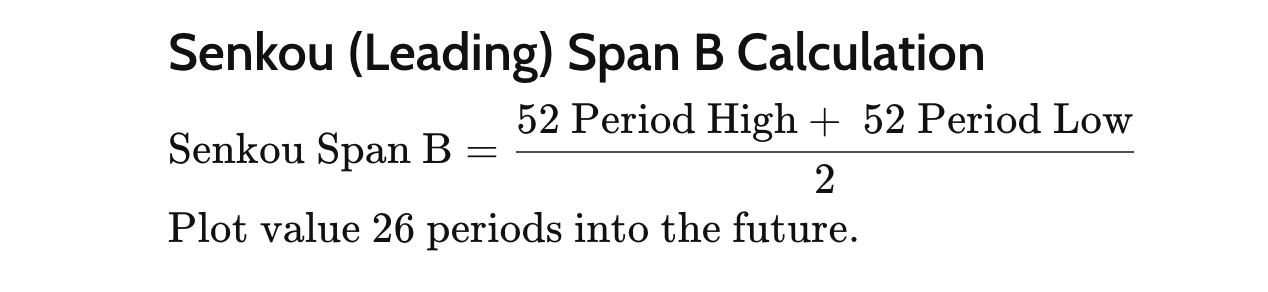
- Senkou Span B
It is the Midline of 26 periods high and 26 periods low. It is shown as the up and downline of Kumo Cloud where investors should monitor where the price is trading based on Senkou Span A and B.
How to trade using Ichimoku Cloud in trading strategy?
It is a complex method that is very effective in cryptocurrency trading. Traders can use this indicator alone as it has many legs to show the price direction from a birds-eye view.
The ideal approach using this method is to find the market trend and open buying/selling positions once the price is ready to follow the long-term trend. In that case, traders can use a multi-time frame or not. The Ichimoku trading method also applies to other indicators like moving average, MACD, or RSI. However, the best approach is to use an oscillator besides the primary indicator to increase the trades probability.
A short-term trading strategy
In the short-term trading method, we will see how to buy or sell any crypto token in the intraday chart. In this method, the aim is to gain from the short-term fluctuation without holding it for a long time. It is a riskier method than long-term HODLing, and it requires deep technical analysis knowledge.
Bullish trade scenario
The bullish trade needs the price to remain above the Kumo Cloud to consider the overall trend as bullish. Later on, a correction will come where traders need to monitor the price regularly. Once the price moves from the correction, it is time to buy.
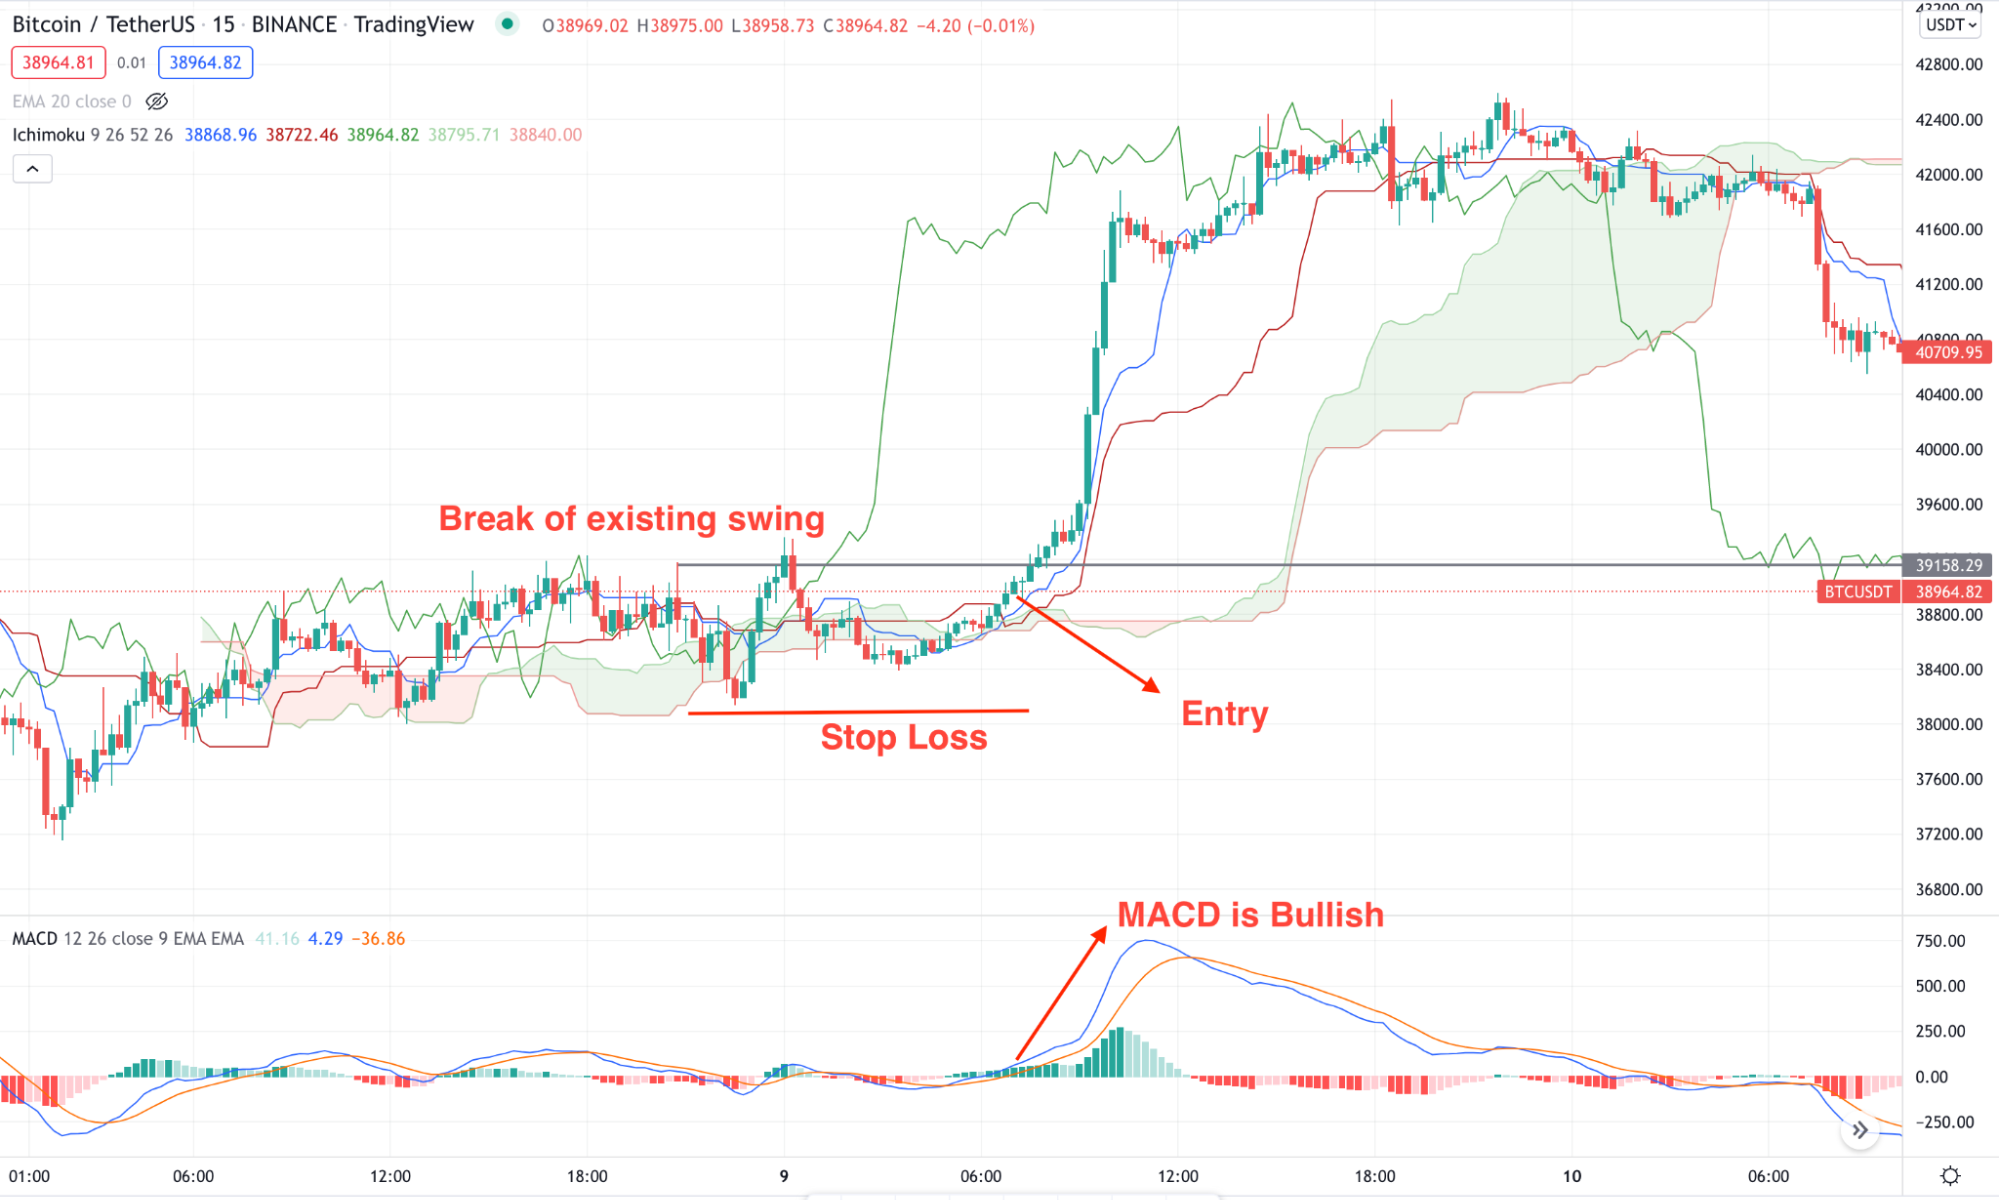
As per the above example, the buy trade is valid from the following condition:
- A new bullish swing break above the Kumo Cloud represents the primary attempt of bulls.
- The price should come lower with a corrective momentum.
- Once the correction is complete and the price formed a bullish candle above the dynamic Kijun Sen the buy trade is valid.
- The SL is below the swing low and the TP is based on RR.
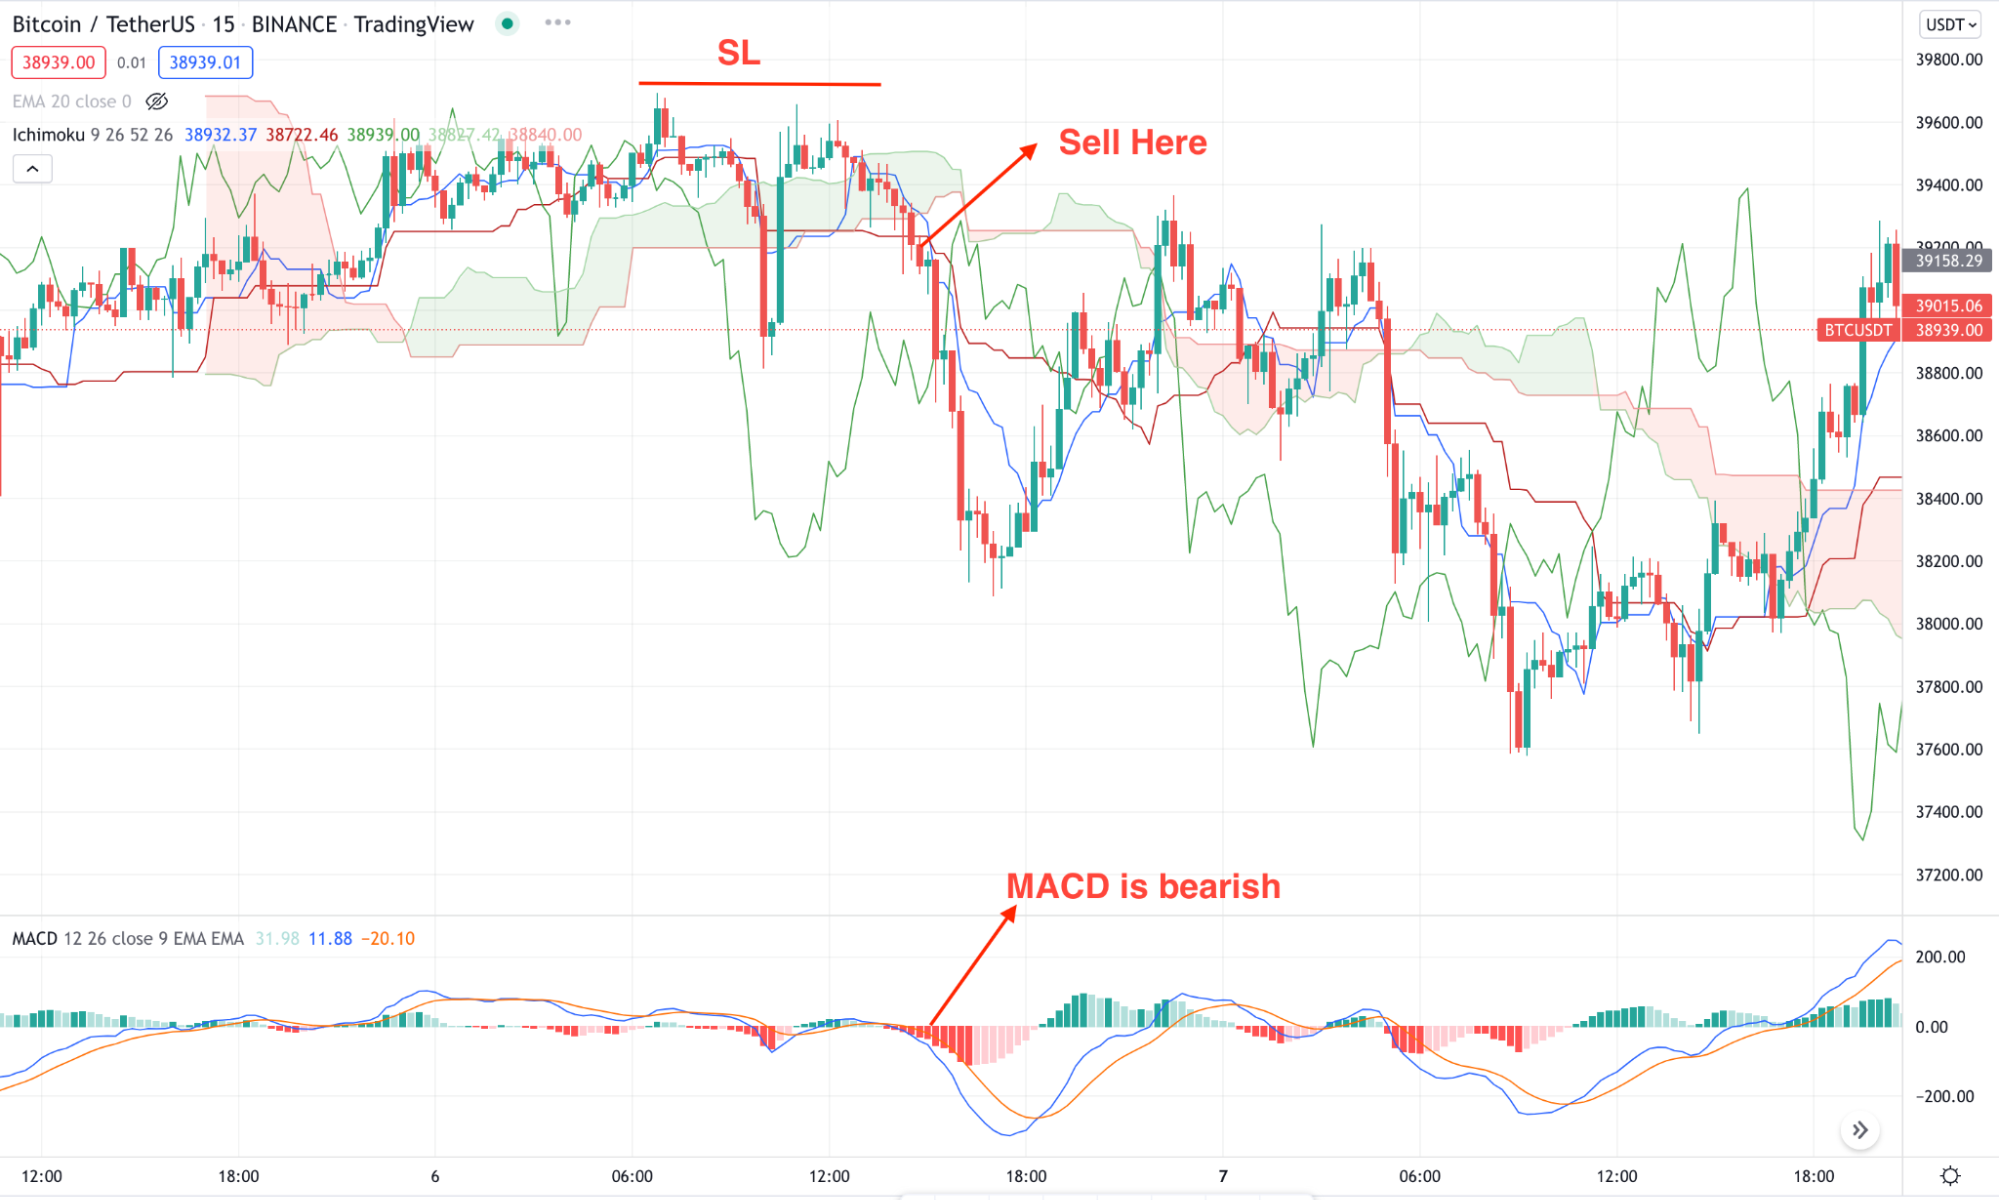
Bearish trade scenario
The bearish trade is the opposite version of the intraday buys trade that is applicable on the CFDs only.
Before opening a sell trade make sure to find these conditions in the price chart:
- The price is trading below the Kumo Cloud indicating that bears are in control.
- A minor bullish correction appears with a failure to take over the cloud resistance.
- Bears took control over the price again with a sell candle below the Kijun Line.
- The sell trade is valid once the price forms a bearish rejection from the Kijun Sen.
- The SL is above the near-term swing high and TP is based on risk and reward.
A long-term trading strategy
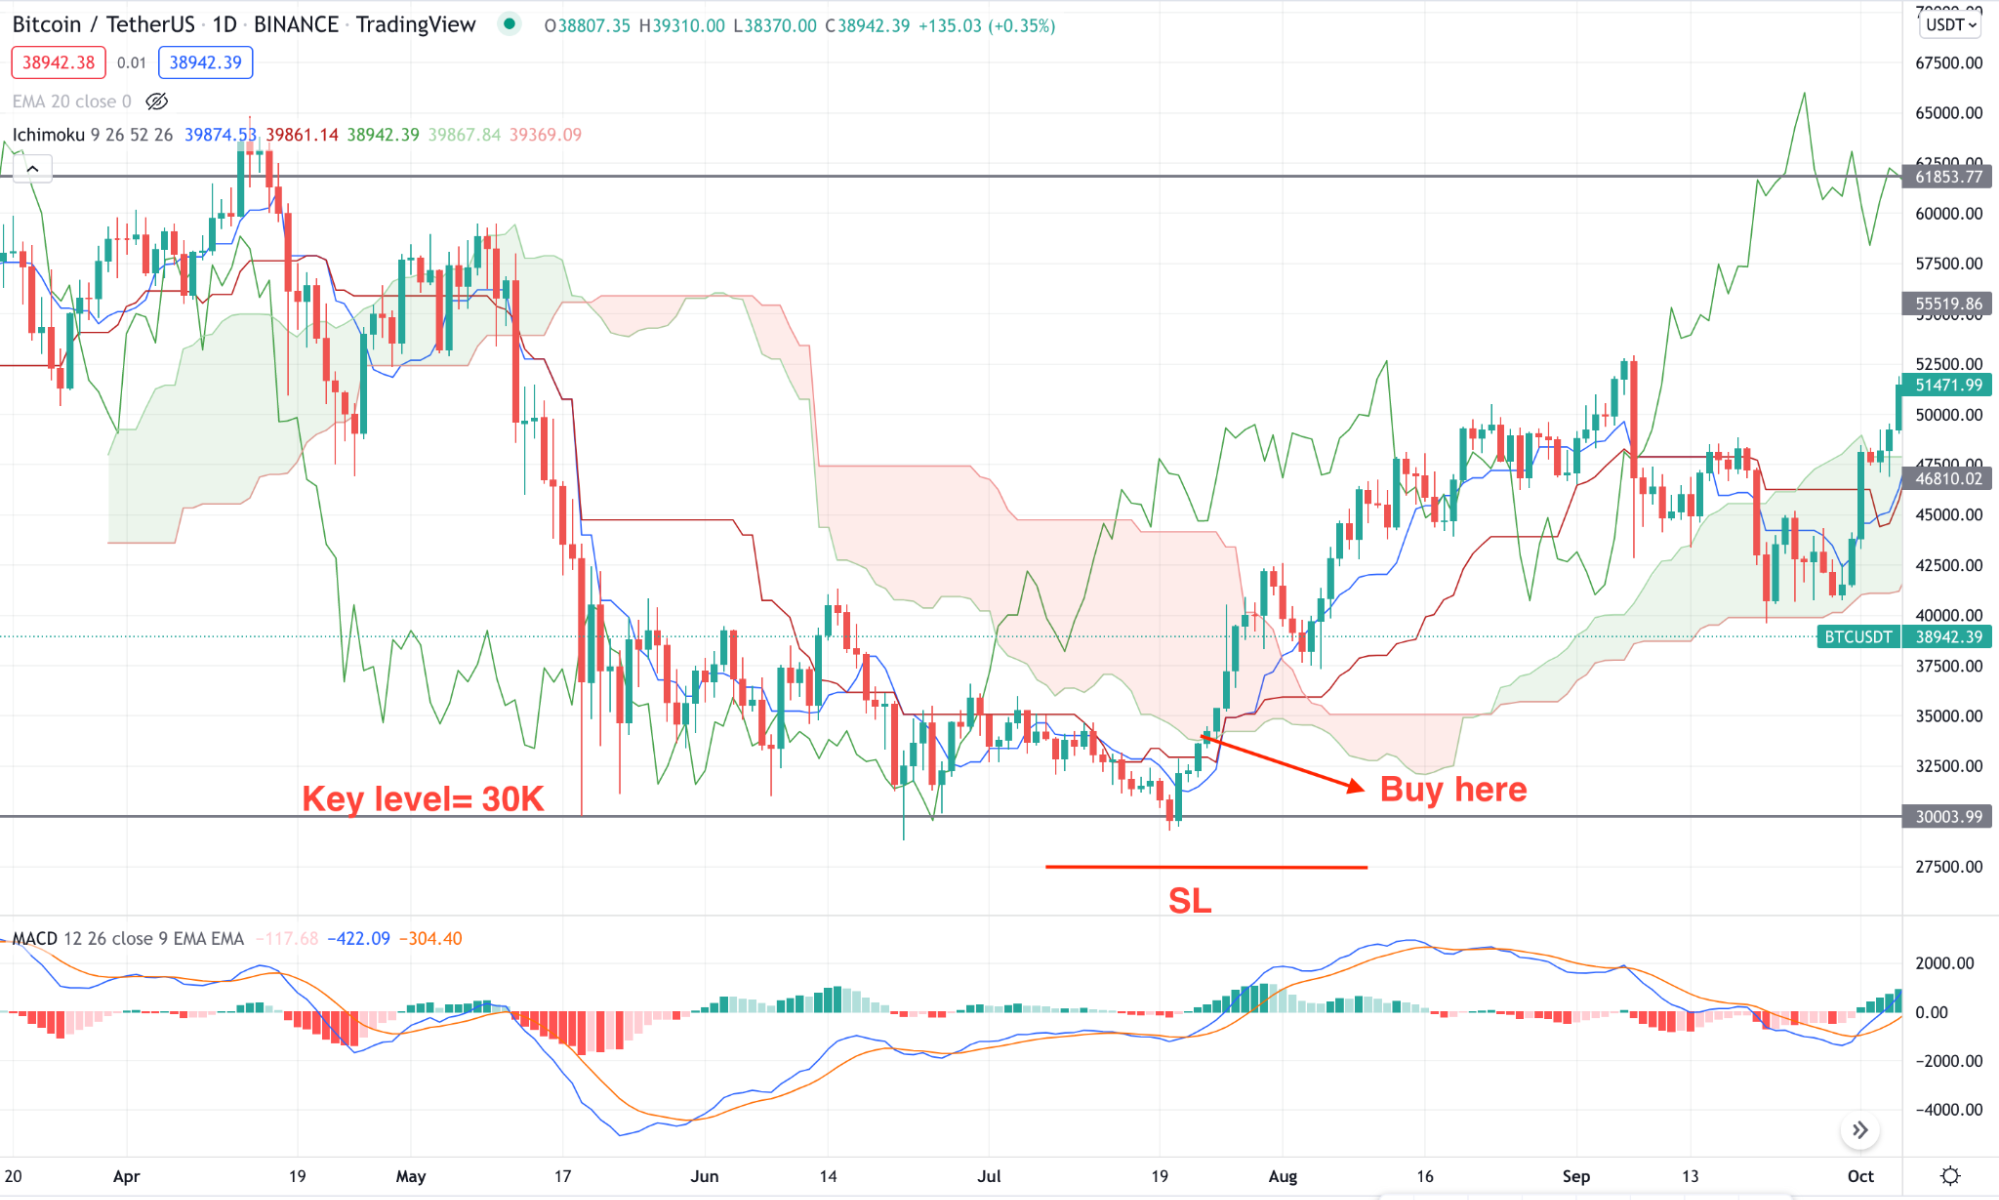
The long-term method applies to finding the time to buy and hold the trade for the long run. Therefore, this method applies to higher time frames like daily or weekly.
Bullish trade scenario
The buying trade is valid once the following conditions appear in the price:
- The price reached any key support level, which is visible in the naked chart.
- The gap between the price and dynamic Kijun Sen extended.
- The future cloud is extremely bearish.
- A bullish rejection appeared with a long wicked candle above the Kijun Line to validate the buy.
- The stop loss and take profit is based on the risk vs. reward ratio.
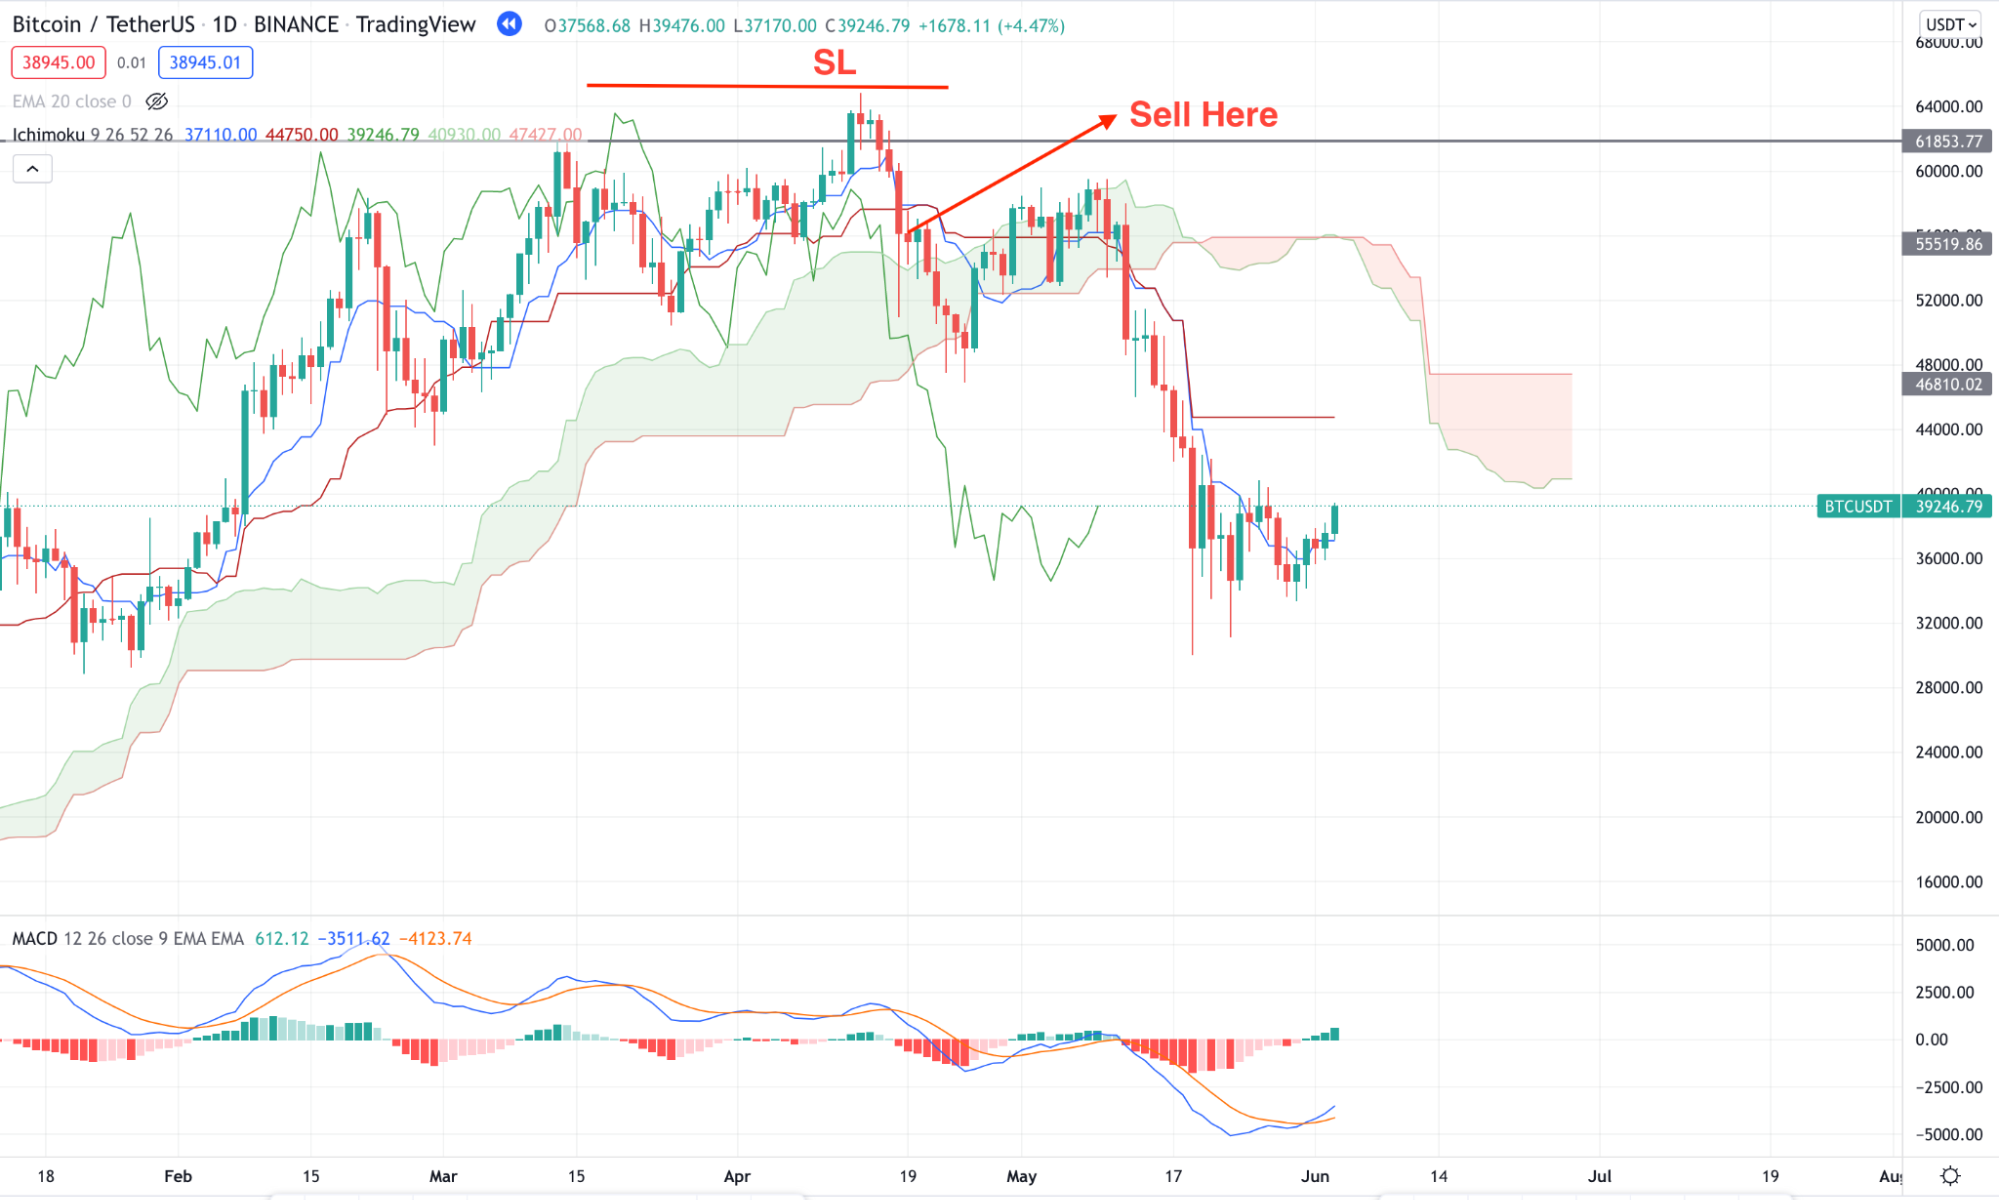
Bearish trade scenario
The buying trade is valid once the following conditions appear in the price:
- The price reached any key resistance level, which is visible in the naked chart.
- The gap between the price and dynamic Kijun Sen extended.
- The future cloud is extremely bullish with a strong gap between Senkou Span A and Senkou Span B
- A bearish rejection appeared with a long wicked candle below the Kijun Line to validate the sell.
- The stop loss and take profit is based on the risk vs. reward ratio.
Pros & cons
| Pros | Cons |
|
|
|
|
|
|
Final thoughts
It is more than a trading indicator as it has several tools to define the price with a better understanding. Therefore, investors can consider it as a reliable trading method.
On the other hand, excessive volatility is the primary barrier for traders. Based on it, market participants need to find when the overall price direction is stable before taking trades.


