
Fear and greed (F&G) are two common facts that every trader faces while making decisions. Meanwhile, the F&G index is valuable for generating profitable trade ideas.
This article will describe crypto trading strategies using this index. Additionally, we will list the top pros and cons to understand the potential alongside discussing the concept. However, it is mandatory to understand the whole concept clearly while using any tool or concept to make trade decisions.
What is the crypto fear and greed index?
This tool indicates whether the market is bullish or bearish by measuring investors’ marketplace sentiments. Extreme fear declares that investors are apprehensive about their investments and maybe opens buy opportunities. On the other hand, excessive greed leads investors to rapid buying and may open selling opportunities due to correction as a usual supply-demand concept.
How to trade using the fear and greed index?
The index is a powerful tool to obtain the market context and make trade decisions. It shows results in an independent window that ranges between 0-100, and a dynamic line moves within these levels.
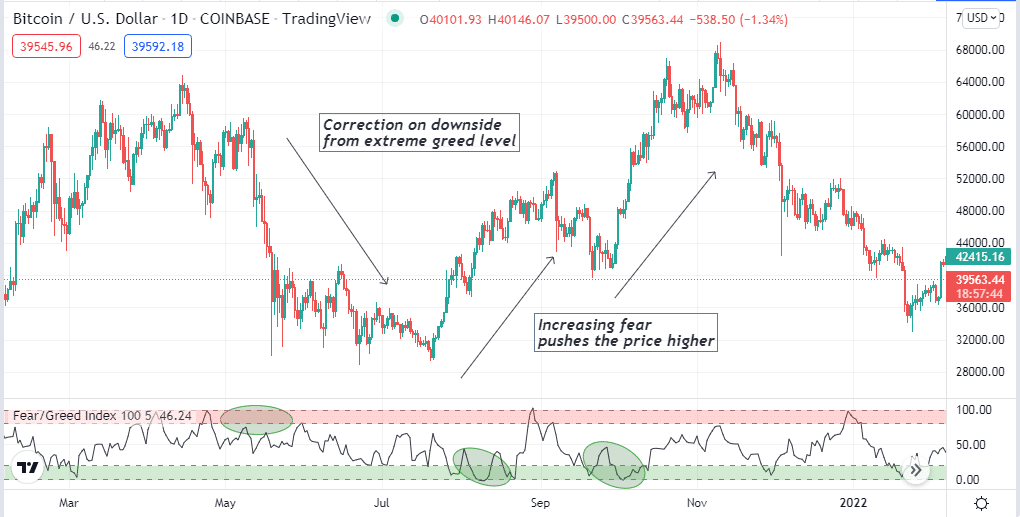
When the bar comes to near zero (0.00), it declares increasing fear and opens buying opportunities. Meanwhile, the reading reaches the red zone or near hundred (100) line, announcing increasing greed or buying pressure and signals a potential upcoming bearish pressure due to correction. You can use this concept alone or combine it with other valuable tools and indicators to catch the most potent trades or create sustainable trading methods.
A short-term trading strategy
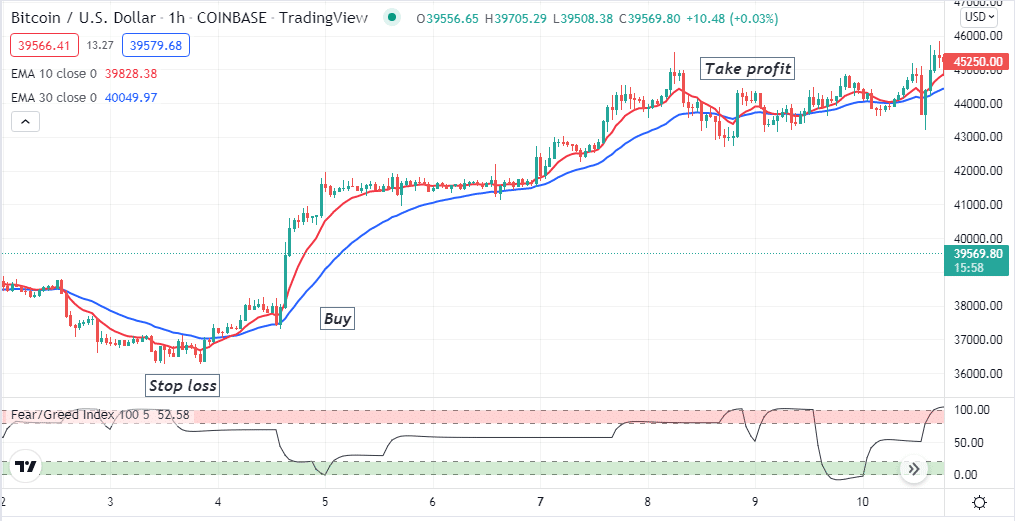
This trading method combines the moving average crossover with the F&G index to generate short-term trading ideas on crypto assets. We use EMA 10 (red) and EMA 30 (blue) lines to implement the MA crossover concept. When the EMA 10 reaches above the EMA 30 declares a buying pressure on the asset price and vice versa. This trading method is suitable for any trading asset on many time frame charts; we recommend using a 15-m or 1-H chart to catch the most potent short-term trades.
Bullish trade scenario
When the F&G index reading reaches near the fear level or zero line, seek to open buy positions. Check when:
- The red EMA crosses the blue EMA on the upside.
- Both EMA lines are heading toward the upside.
- G&F reading reaches or remains at the fear level and starts to head on the upside.
Entry
When these conditions above match your target asset chart, it declares a potential upcoming upward movement. Open a buy position.
Stop loss
Place an initial stop loss below the current low with a buffer of 5-10pips.
Take profit
Close the buy position when:
- The red EMA crosses the blue EMA on the downside.
- F&G index reaches the greed level declaring extreme buying pressure.
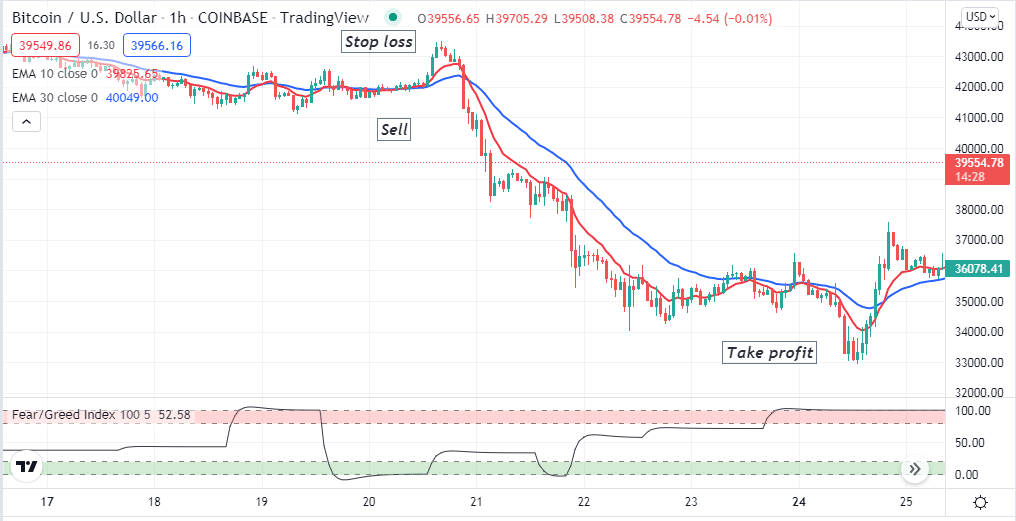
Bearish trade scenario
When the F&G index reading reaches near the greed level or the hundred (100) line, seek to open sell positions. Check when:
- The red EMA crosses the blue EMA on the downside.
- Both EMA lines are heading toward the downside.
- F&G reading reaches or remains at the greed level and starts to head on the downside.
Entry
When these conditions above match your target asset chart, it declares a potential upcoming downward movement. Open a sell position.
Stop loss
Place an initial stop loss above the current swing high with a 5-10 pips buffer.
Take profit
Close the sell position when:
- The red EMA crosses the blue EMA on the upside.
- F&G index reaches the fear level declaring extreme selling pressure.
A long-term trading strategy
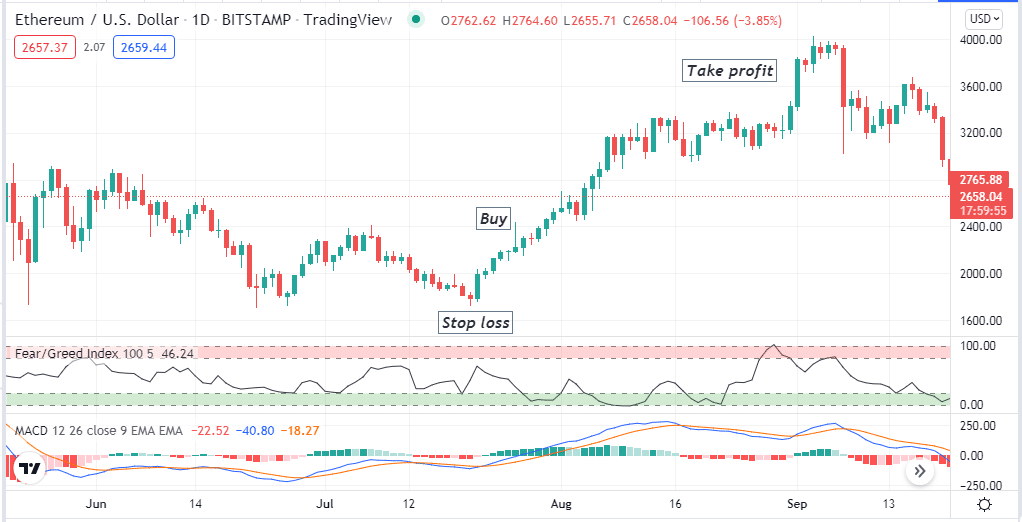
We combine another popular indicator, MACD reading, with the F&G index to seek potential long-term trading positions in this trading method. Both indicators show readings on independent windows; the MACD indicator contains two dynamic signal lines and histogram bars on both sides of a central (0.0) line. This trading method suits any trading asset; we recommend using an H4 or D1 chart to catch the most potent long-term trades.
Bullish trade scenario
When the F&G index reading reaches the fear level, seek to open buy positions. Check when:
- The F&G index reading is near zero (0) or fear level.
- The dynamic blue line crosses the dynamic red line on the upside at the MACD window, and both lines head toward the upside.
- MACD green histogram bars take place above the central (0.0) line.
Entry
When these conditions above match your target asset chart, it indicates a bullish pressure on the asset price. Place buy order.
Stop loss
The initial stop loss will be below the bullish momentum.
Take profit
Close the buy order when:
- The F&G index reaches greed level.
- The dynamic blue line crosses below the dynamic red line on the MACD window.
- MACD red histogram bars take place below the central (0.0) line.
Bearish trade scenario
When the F&G index reading reaches the greed level, seek to open sell positions. Check when:
- The F&G index reading is near the hundred (100) or greed level.
- The dynamic blue line crosses the dynamic red line on the downside at the MACD window, and both lines head toward the downside.
- MACD red histogram bars take place below the central (0.0) line.
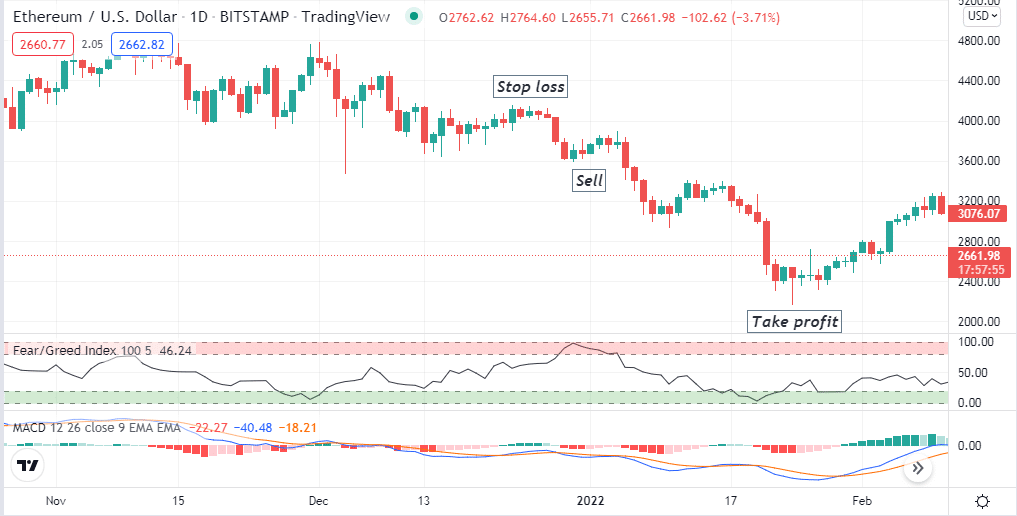
Entry
When these conditions above match your target asset chart, it indicates a bearish pressure on the asset price. Place sell order.
Stop loss
The initial stop loss will be above the bearish momentum.
Take profit
Close the sell order when:
- The F&G index reaches fear level.
- The dynamic blue line crosses above the dynamic red line on the MACD window.
- MACD green histogram bars take place above the central (0.0) line.
Pros & cons
| Pros | Cons |
|
|
|
|
|
|
Final thought
This index depends on a beneficial concept and fine tool that suggests trades according to investors’ sentiments. You can use many other technical tools and indicators to combine with the F&G index to create invincible trading strategies such as RSI, Parabolic SAR, Bollinger Bands, etc.


