
Aroon indicator is a custom trading tool that helps traders to catch the early trend. The core idea of using this indicator is to remain at the beginning of a trend and get maximum juice from the market.
In every financial market, trend trading is more profitable than trading in a volatile market. Therefore, market participants who can catch the trend ideally and from the beginning have a higher possibility of getting higher returns with a minimum risk. Moreover, when the price remains within the trend, it mostly follows other indicators or price action-based strategies.
This indicator is designed to observe the market differently and find the more accurate trend shifting point. In this article, we will discuss the use of this tool with case studies.
What is the Aroon indicator?
The meaning of Aroon in Sanskrit is “Dawn’s early light.” it is a technical tool that shows the market sentiment by indicating whether it is within a trend or range. Tushar Chande invented this indicator as an oscillator class. In the price chart, we can use it to find the trend more precisely.
In the traditional momentum indicator, traders find the buying and selling point from an extreme position — it is a price level after a solid movement from where a correction or reversal is possible.
Therefore, it is hard to find the exact reversal point quickly found using the Aroon indicator. However, it is available free for all trading platforms and is open in a separate window with two lines:
- Aaron up
- Aroon down
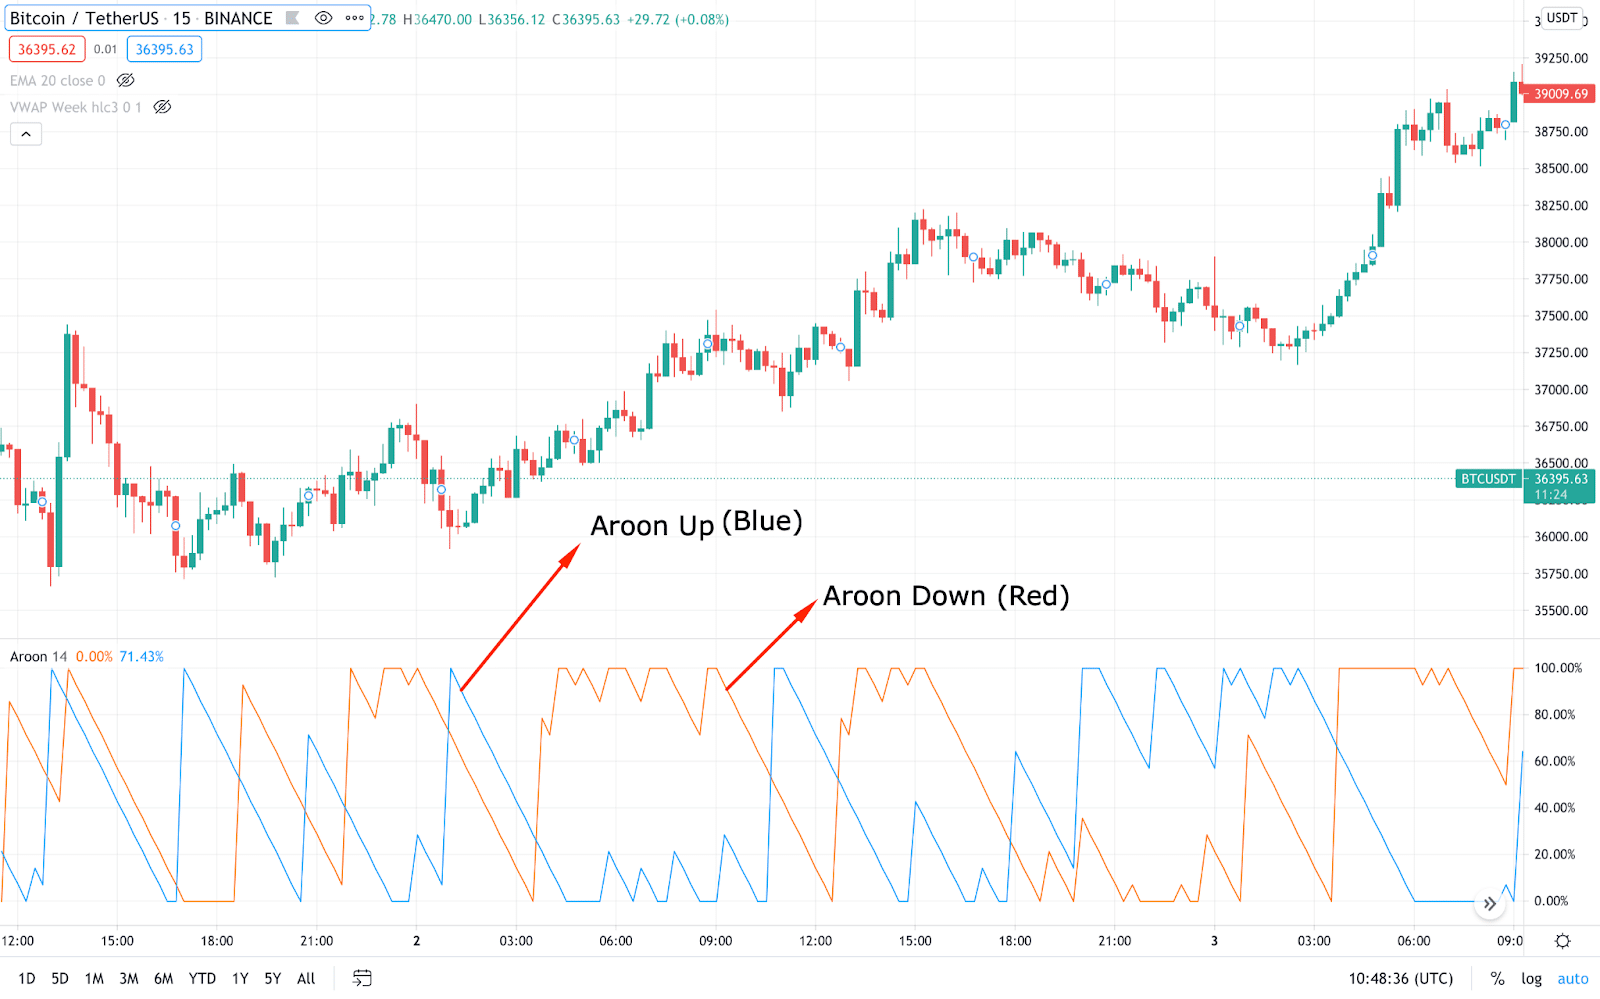
The above image represents how Aroon up & down looks like in a price chart. It is easily visible in the chart with two separate lines.
Find the trend direction using the Aroon indicator
Aroon is easily finable in trading indicators like Tradingview or free custom as MT4 or an MT5 platforms. If you look at the above image, you should know that the Aroon indicator has two lines. The main price event happens when these two lines cross over.
- When Aroon up moves above the Aroon down and reaches 100% level, it indicates an extreme buyers presence in the price.
- When Aroon down moves above the Aroon up, it indicates that sellers became active in the price, and we are likely to face a beginning phase of a bearish trend.
Therefore, the crossover is the primary requirement; remaining at 70% to 100% is secondary. Let’s have a look at an example.

The above image can quickly show how Aroon up crosses over Aroon down and initiates a bullish trend. Moreover, the price rejected bears a strong pin bar that pushed the price up with a minimum of 1:5 risk: reward.
Case examples
This section will provide a detailed guide regarding how to find the price direction using Aroon шndicator. For this, we will use the Bitcoin chart and will look for buy trades. However, this method is applicable in any financial instrument in forex, stocks, or indices.
Step 1. Find the crossover
If the Aroon up (blue line) crosses over Aroon down, it indicates that buyers started to gain momentum, and the price direction may shift from bearish to bullish. Remember that it is applicable on the bearish market, and it intends to find the first sign of the buyer’s attempt.
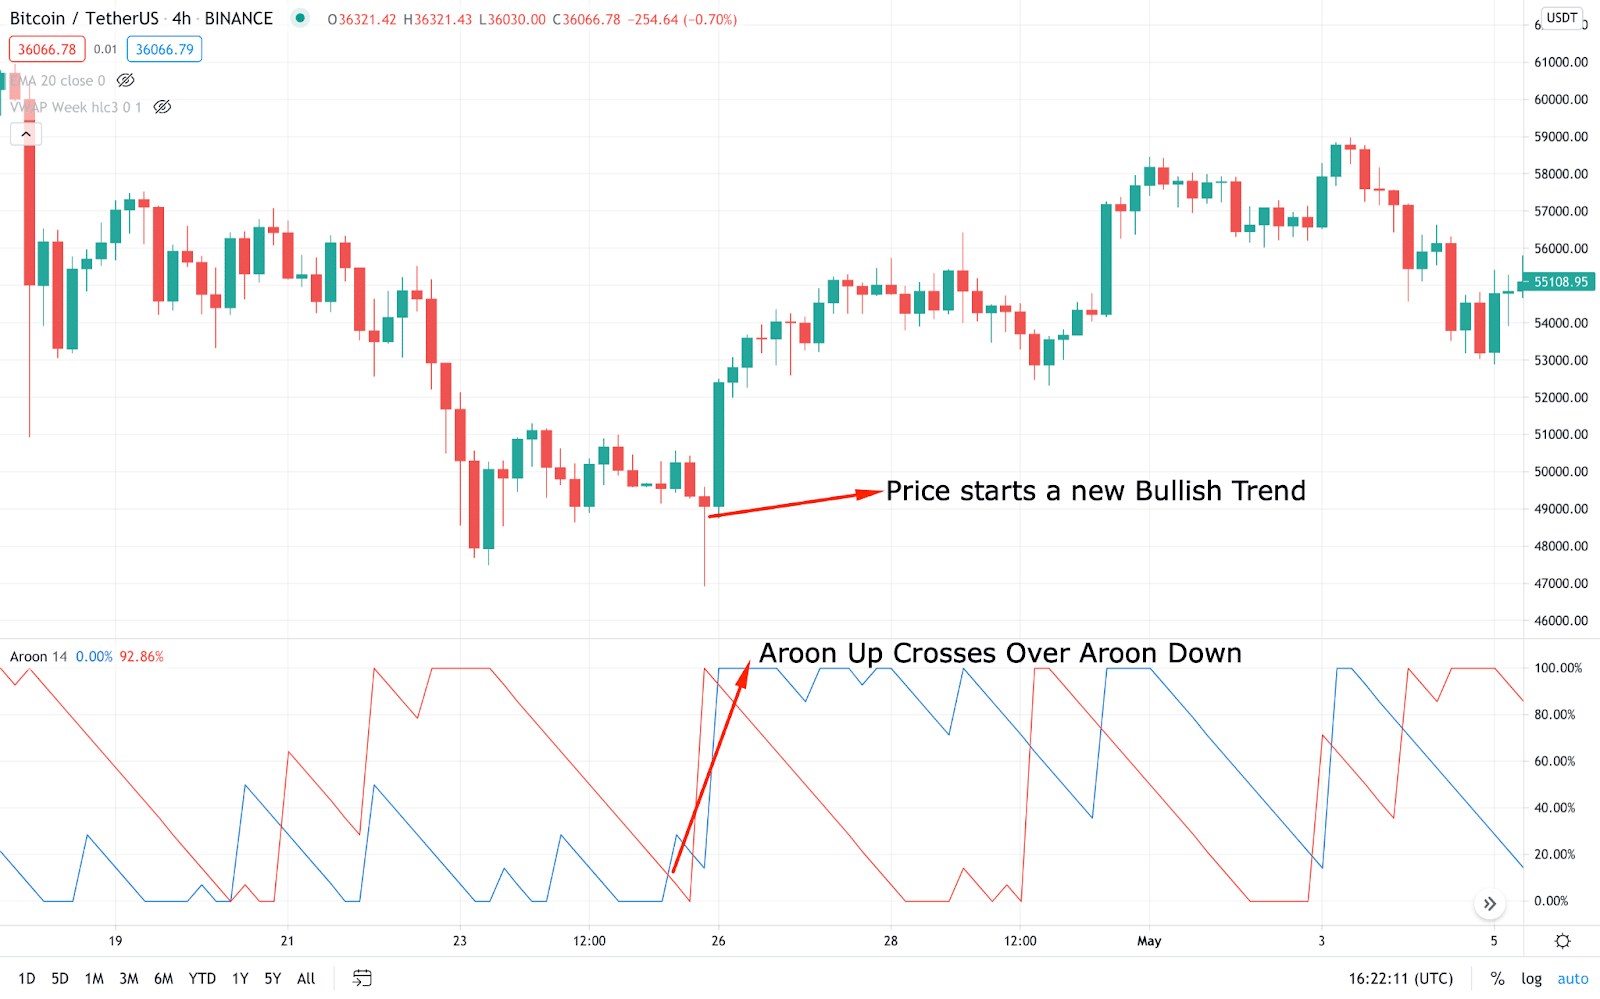
As per the above image, the price increased with a bearish rejection candlestick and the Aroon bullish crossover. Moreover, the price was at a support level, which increases the buying possibility.
Step 2. Find the strong trend
In the above step, we have found a new trend, which is not enough to consider the upcoming trend as bullish. We cannot take trades immediately after the crossover. Rather, we have to wait a bit to find the Arron line at 100% level.
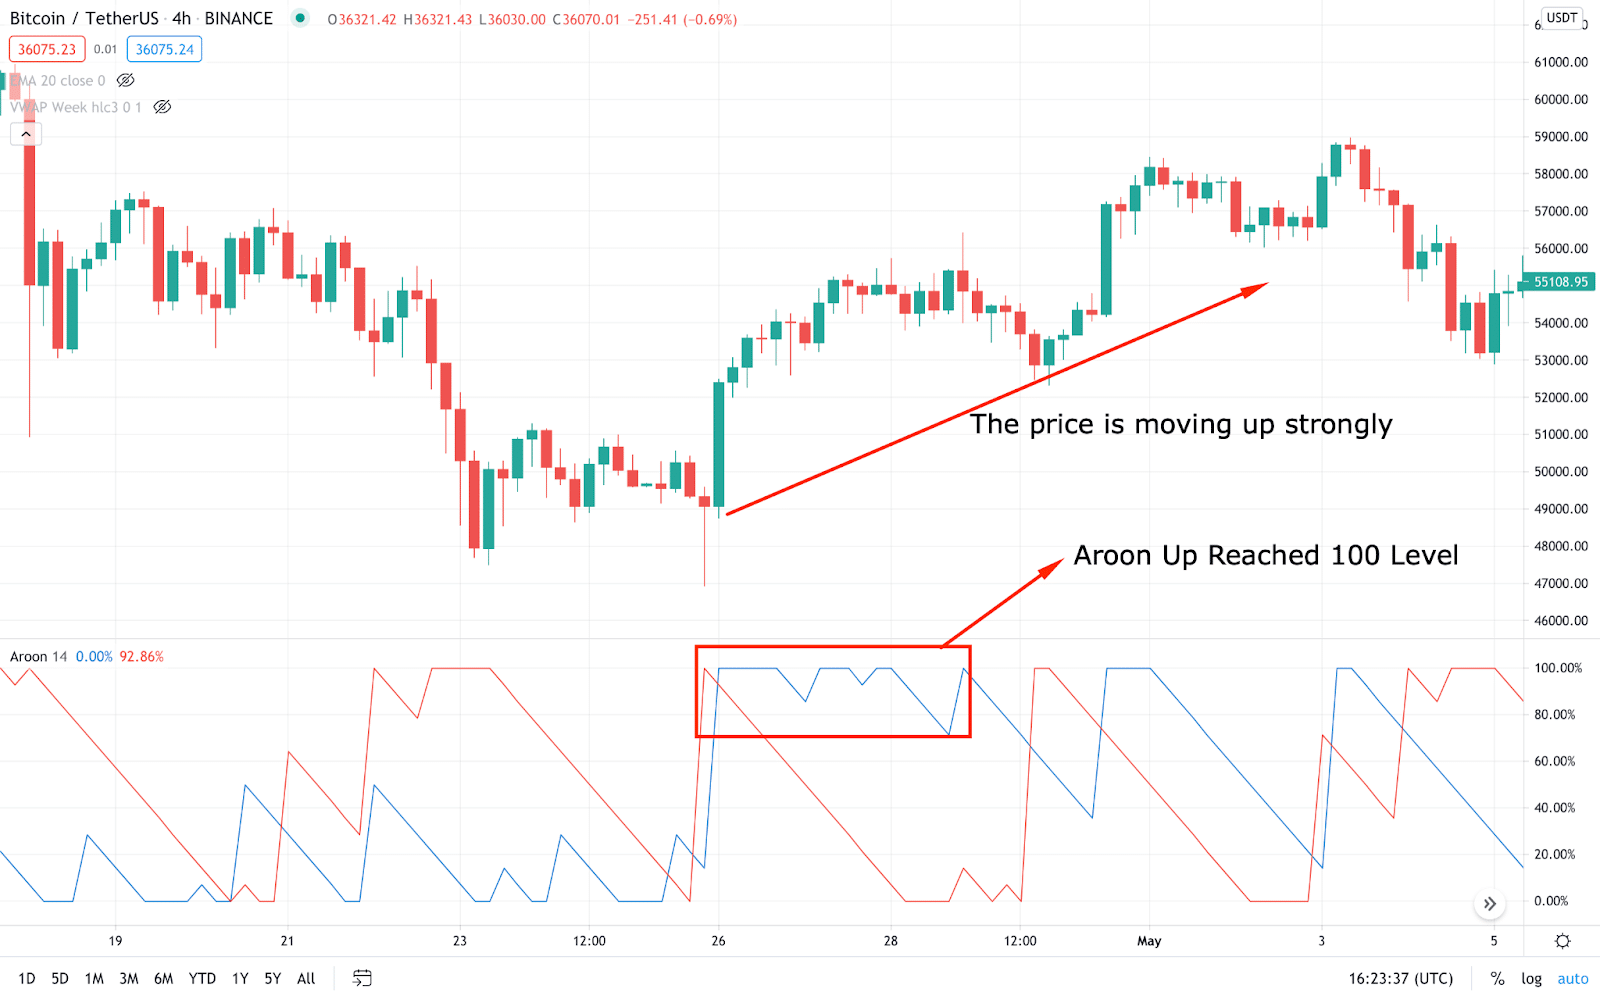
In the above image, we can see how the Aroon Up reached the 100% level that made the sharp movement in the chart. The price direction is valid in any crossover once the Arron indicator comes to the 100% level.
Step 3. Find the exit point
Once the Aroon up or down reaches 100% level, we can consider the current trend as strong. But, the question remains, how long the momentum may stay?
The bullish trend will be valid as long as Aroon stays above the 70% level. The duration of 100% to 70%, after a bullish crossover, is buyers’ market. Therefore, in any trading strategy, you should find only buy signals at that time. If the Aroon moves down, buyers have started losing their momentum, and sellers joined the market.

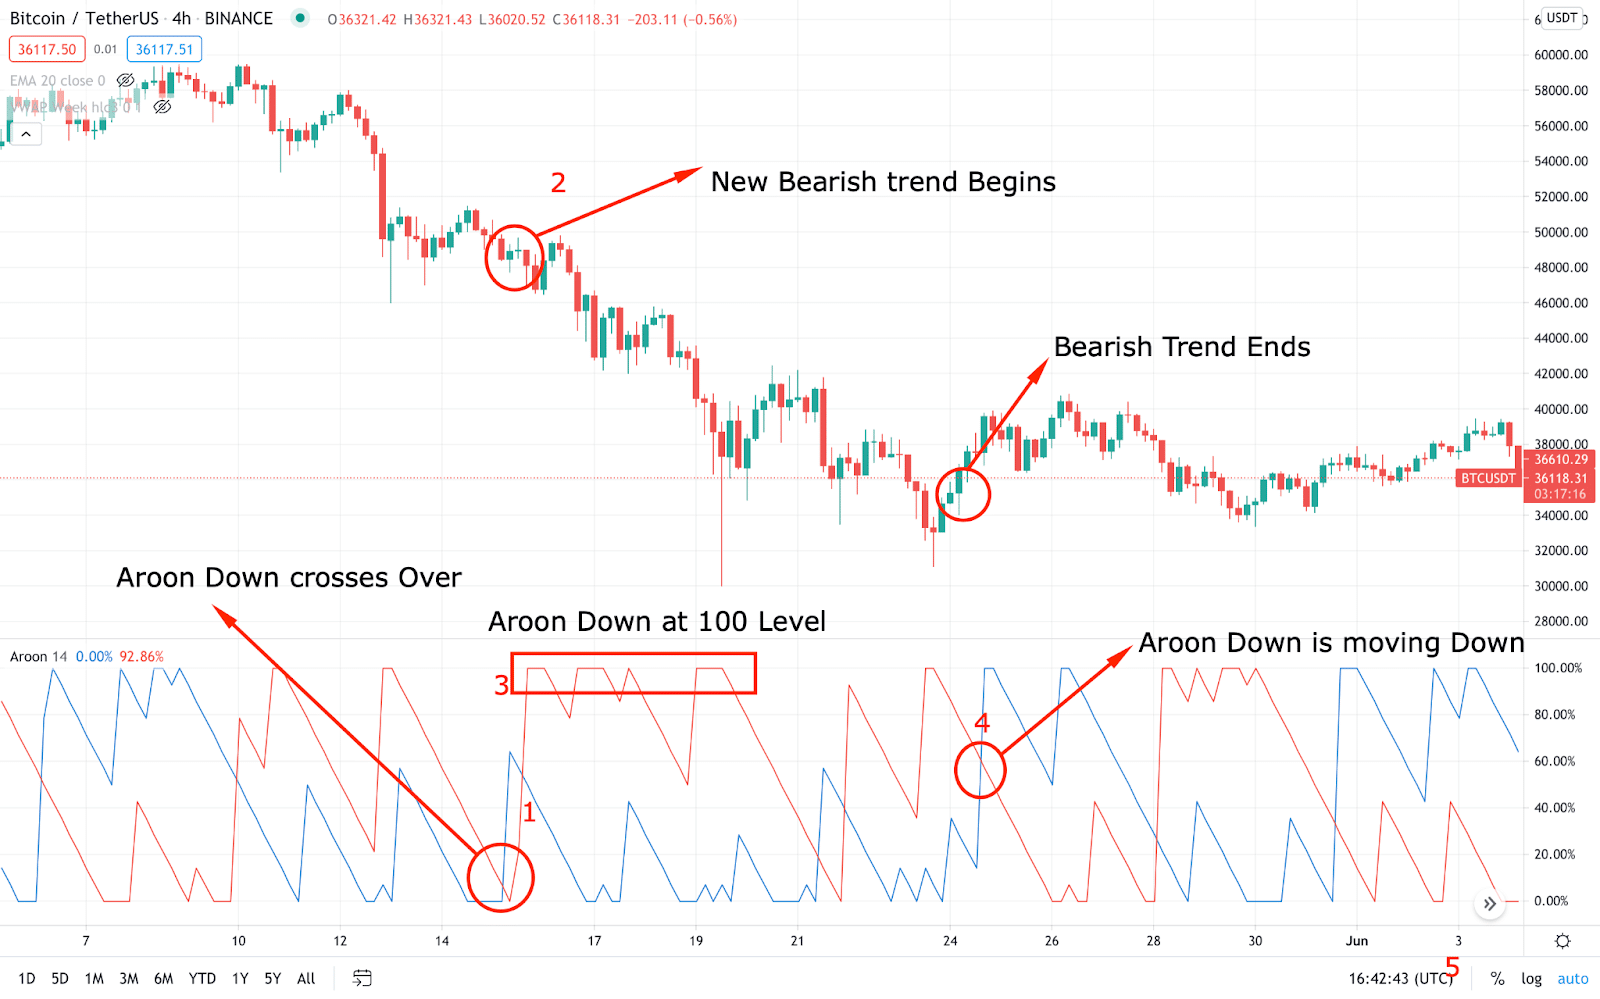
The above image shows how the Aroon up moved below the 70% level. Even crosses below the Aroon down, indicating that buyers have lost their momentum and sellers joined the market.
Considering the above example, we can come into the closing with the following rules:
- A bullish crossover = buy trend is forming
- A bearish crossover = a sell trade is forming
- The validity of the trend = until the Aroon line is within 70% level
Final thoughts
After the above discussion, we can conclude that Aroon is an essential and profitable indicator applicable in any financial market. However, its strength depends on the time frame. The higher timeframe always provides a better result. Therefore, you can use it to identify the early trend that may help you close the current position or wait for the next step.
Moreover, you can integrate this indicator with the trading tools like moving average, Bollinger Bands, or price action and create a profitable trading strategy.
