
Technical indicators are a considerable part of the financial market. Market participants use many indicators to determine potentially good entry/exit points that involve low risks and high profitability. The Keltner channel is one of the most popular among market participants. However, there is no alternative to learn the indicator’s functionality and participants’ behavior before trading with that tool.
Let’s learn how to trade it with profitable strategies, as we describe procedures using this indicator with chart attachments.
What is a Keltner channel strategy?
The inventor of this indicator is Chester W. Keltner, who described it in 1960 in his book “How to Make Money in Commodities.” The initial description contains a 10-day MA; the middle line declares typical price movement.
Later, this indicator has some modification that uses different average periods besides utilizing the concept of ATR value by Linda Bradford Raschke. The revision is acceptable and frequently usable to financial traders as the main idea remains intact.
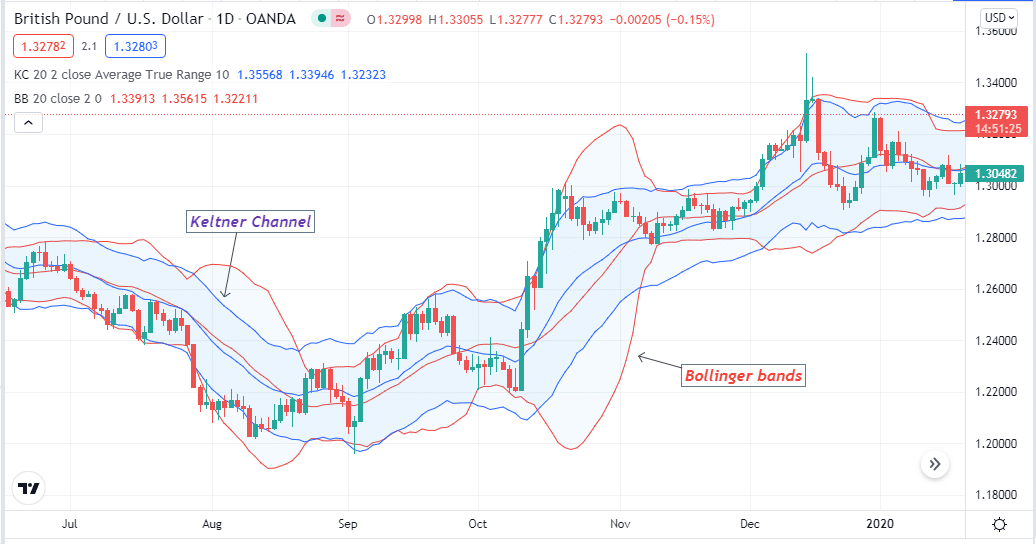
This indicator has three bands similar to the Bollinger Bands (BB) indicator, although the calculations are different.
- The Keltner uses highs/lows to represent the volatility.
- The BB depend on the standard deviation of the price movement.
Both indicators share similarities in appearance and provide signals when the price breaks above or below the range. The Keltner channel typically uses an EMA of 20 periods, which is adjustable. The upper and lower band declares dynamic resistance and support levels.
Therefore, when the price reaches or remains on the upper channel declares a bullish price movement and inversely moves on the lower channel, it declares a bearish trend.
How to trade it?
It is an easily applicable technical indicator that defines the trends and the reversal points depending on the market context. Executing trades using it has no compliance.
- When the price reaches the support level or at the lower band, it may bounce to the upside.
- When it reaches the resistance, a declining pressure may come.
- When it breaks above channel range trigger an uptrend and vice versa.
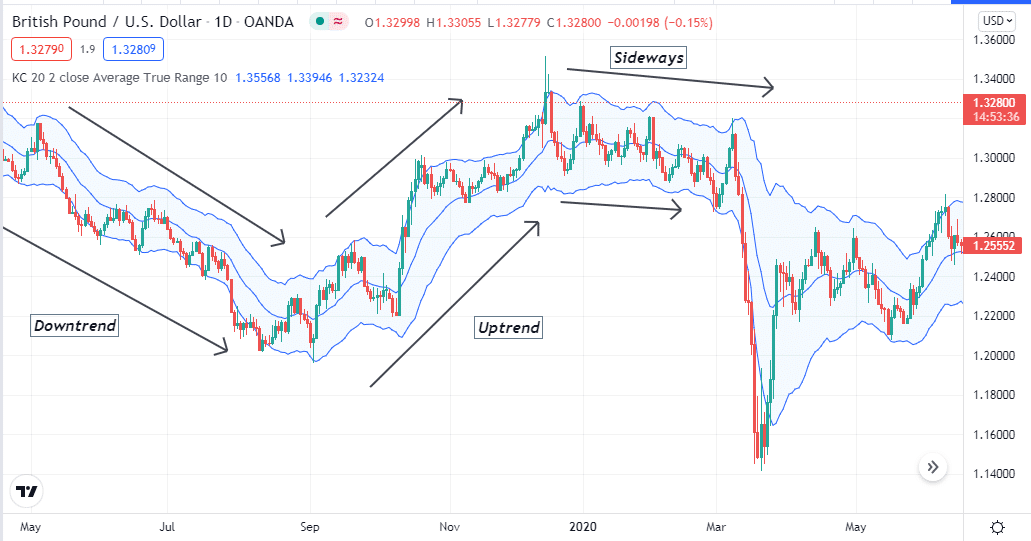
For a downtrend, the price remains at the lower channel between the lower and middle band, and inversely the price remains at the upper channel for an uptrend. Price candles will frequently cross the middle band upside and downside in a consolidating phase or sideways.
You can use other technical indicators and combine them to get more accurate entry/exit positions, such as ADX, MACD, RSI, etc.
A short-term trading strategy
This method uses the Average Directional Index besides the Keltner. ADX indicator determines the current trend’s strength by a single dynamic signal line on an independent window.
- When the ADX value reaches above 20, it declares sufficient strength of the current trend.
- Meanwhile, it continues to slope upside as the trend strength increases and slopes downside with decreasing strength of the current trend.
We recommend using this strategy on a 15-min chart to obtain the best results.
Bullish trade scenario
Apply those indicators and observe when:
- The price reaches above the upper band of the Keltner channel indicator.
- ADX value is above 20.
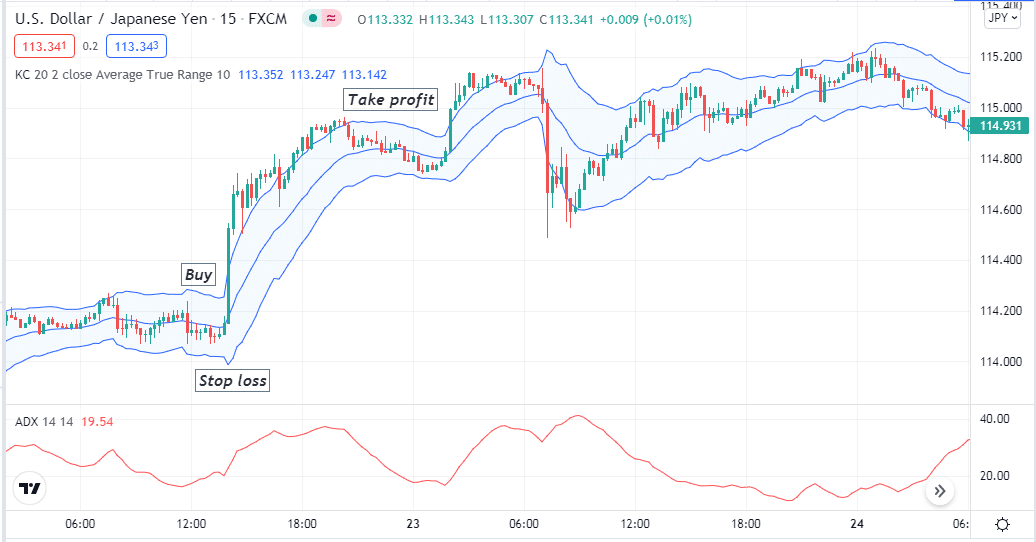
Entry
Place a buy order when these conditions above match your target asset chart.
Stop loss
Place an initial SL below the current swing low.
Take profit
You can continue the buy order until the price moves on the upper channel. Close the buy position when the price reaches below the middle band, or the ADX value decreases below 20.
Bearish trade scenario
Apply those indicators and observe when:
- The price reaches below the lower band of the Keltner channel indicator.
- ADX value is above 20.
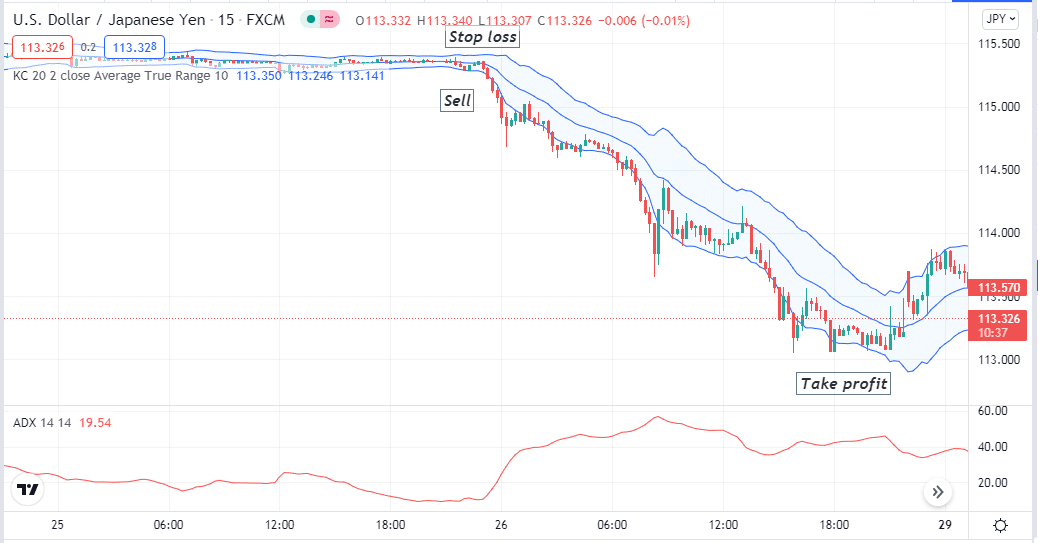
Entry
Place a sell order when these conditions above match your target asset chart.
Stop loss
Place an initial SL above the current swing high.
Take profit
You can continue the sell order until the price moves on the lower channel. Close the sell position when the price reaches above the middle band, or the ADX value decreases below 20.
A long-term trading strategy
It involves the MACD, one of the most popular momentum indicators besides the Keltner channel, to determine potential trading positions. This method suits any trading instrument. We recommend using an H4 or above chart to identify precious long-term entry/exit points.
Bullish trade scenario
Apply those indicators and observe when:
- The dynamic blue line crosses the dynamic red line on the upside of the MACD window.
- Green histogram bars take place above the central line.
- Price is above the middle band or at least once reaches above the upper band of the Keltner channel indicator.
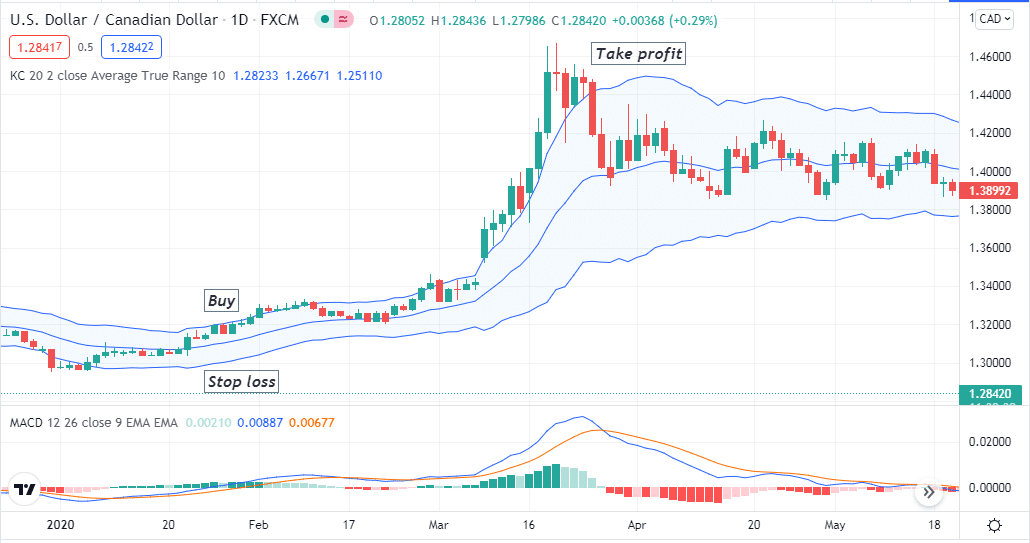
Entry
Open a buy position after matching those conditions above.
Stop loss
Your buy order’s initial SL level will be below the current swing low.
Take profit
You can continue your buy position until the price moves on the upper channel. Close the buy order when:
- The blue line crosses below the red line on the MACD window.
- Red histogram bars take place below the central line.
- Price crosses below the middle band of the Keltner tool.
Bearish trade scenario
Apply those indicators and observe when:
- The dynamic blue line crosses the dynamic red line on the downside of the MACD window.
- Red histogram bars take place below the central line.
- Price is below the middle band or at least once reaches below the lower band of the Keltner channel indicator.
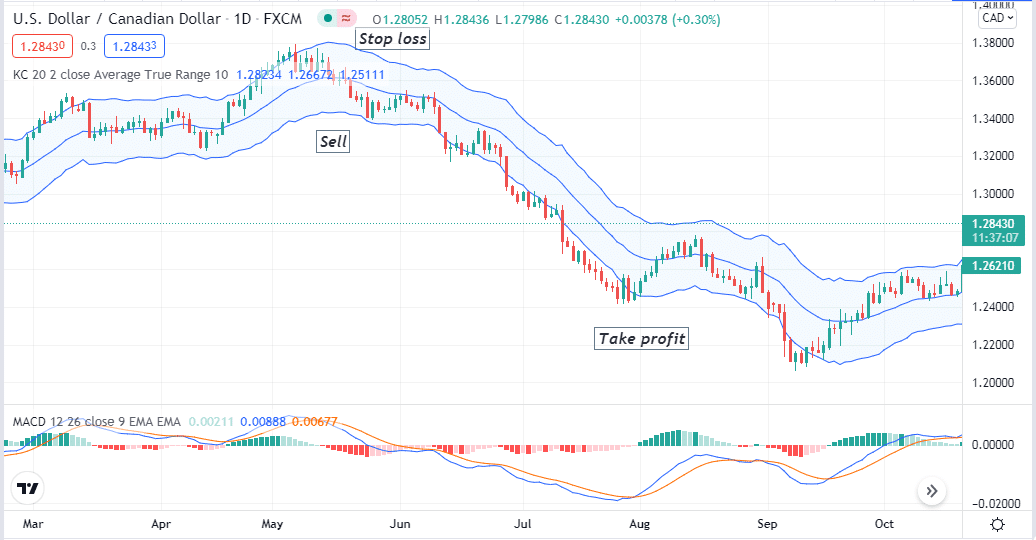
Entry
Open a sell position after matching those conditions above.
Stop loss
Your sell order’s initial SL level will be above the current swing high.
Take profit
You can continue your sell position until the price moves on the lower channel. Close the sell order when:
- The dynamic blue line crosses above the dynamic red line on the MACD window.
- Green histogram bars take place below the central line.
- Price crosses above the middle band of the Keltner channel indicator.
Pros and cons
| Pros | Cons |
| This concept is useful to execute automated trading. | Many consider the Keltner channel as a lagging indicator. |
| Placing SL is easy through the Keltner channel. | These strategies can fail due to fundamental events. |
| This indicator applies to many trading instruments. | It requires using other indicators to get complete trade setups. |
Final thought
This trading strategy works well when used with other price action-based strategies. Traders can trade this on-trend reversal based on a breakout or breakout of a support or resistance line.
Experienced traders could make even more profits if they could get out of the trade earlier based on price candlestick patterns or other price action analyses. On the other hand, novice traders can stick to these rules and make big profits during strong momentum price movements that lead to a trend.